GLOBAL B2B ECOMMERCE MARKET FORECAST 2023-2032
SCOPE OF THE REPORT
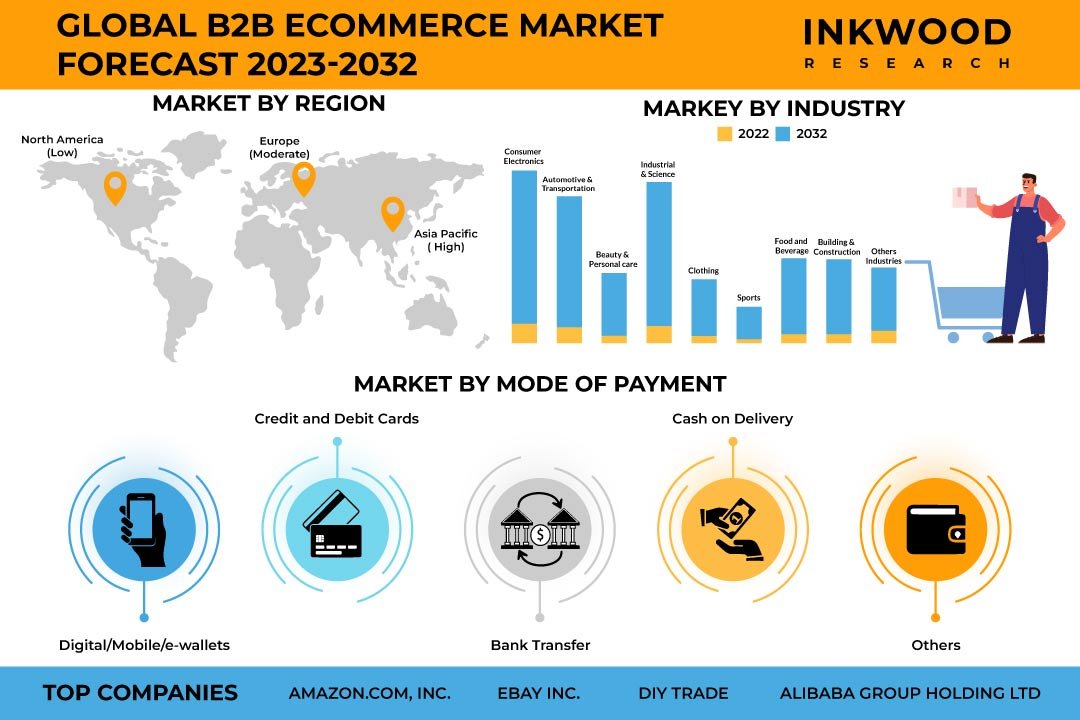
Global B2B Ecommerce Market by Industry (Consumer Electronics, Industrial & Science, Automotive & Transportation, Beauty & Personal Care, Clothing, Sports, Food & Beverage, Building & Construction, Other Industries) Market by Mode of Payment (Digital/mobile/e-wallets, Credit & Debit Cards, Bank Transfer, Cash on Delivery, Other Modes of Payment) by Geography
REPORTS » INFORMATION TECHNOLOGY » E-COMMERCE » GLOBAL B2B ECOMMERCE MARKET FORECAST 2023-2032
MARKET OVERVIEW
The global B2B eCommerce market was valued at $21516.10 billion in 2022 and is expected to reach $166315.23 billion by 2032, growing at a CAGR of 22.50% during the forecast period 2023-2032.
B2B eCommerce refers to online business transactions, encompassing buying and selling goods or services. It has emerged as a vital channel for businesses to streamline their procurement processes, enhance operational efficiency, and aid in expansion.
The global B2B eCommerce market is characterized by digital marketplaces, account-based systems, integration with back-end systems, advanced catalog management, streamlined order processing, and personalized pricing.
The B2B eCommerce market has witnessed significant growth in recent years, driven by digital advancements and changing business dynamics. Technological advancements, such as mobile connectivity, cloud computing, and data analytics, have empowered businesses to embrace digital platforms for their commercial activities. Similarly, the need for cost optimization, operational efficiency, and improved customer experience has also fueled the adoption of B2B eCommerce solutions.
Furthermore, COVID-19 positively impacted the B2B eCommerce market growth as businesses sought digital alternatives to traditional offline processes. Supply chain disruptions, travel restrictions, and social distancing measures prompted businesses to rely on online procurement, sales, and collaboration channels. This resulted in increased investments in B2B eCommerce infrastructure, digital marketplaces, and automation solutions.
Read our latest blog on the B2B ECommerce Market
GROWTH ENABLERS
Key growth enablers of the global B2B eCommerce market are:
- Expanding digital orders
- As businesses across the globe embrace digital transformation, the traditional manual processes of order placement, tracking, and fulfillment are rapidly being replaced by seamless digital interactions. This shift has ignited a transformative revolution, ushering in a new era of efficiency, accessibility, and scalability for B2B transactions.
- The expansion of digital orders also catalyzes data-driven decision-making. The wealth of data generated through digital interactions provides valuable insights into customer preferences, buying behaviors, and market trends.
- The total number of digital buyers globally reached about 2.14 billion in 2021. According to Oberlo, there were 900 million more digital buyers in 2021 compared to 2020, a 4.4% year-over-year increase. Moreover, the number of online buyers is set to increase, rising to 2.71 billion by 2024 and 2.77 billion by 2025.
- Technological progress and innovations
- Seamless usage and adoption of diverse payment methods
GROWTH RESTRAINTS
Key factors restraining the global B2B eCommerce market growth are:
- Increasing emphasis on data privacy and security
- As businesses increasingly rely on digital platforms for transactions and interactions, the vulnerability of sensitive data has become a pressing issue that impacts trust, compliance, and overall industry expansion.
- The digital nature of B2B eCommerce involves exchanging valuable information, including financial data, proprietary product details, and confidential business strategies. Accordingly, the potential for data breaches, cyberattacks, and unauthorized access raises alarms among businesses, hindering their willingness to fully embrace online transactions.
- Regulatory frameworks and compliance requirements add another layer of complexity. Businesses operating in multiple regions must navigate varying data protection laws and regulations, leading to concerns about legal ramifications and potential penalties for non-compliance.
- Need for substantial capital investment
To Know More About This Report, Request a Free Sample Copy
KEY MARKET TRENDS
Global B2B eCommerce Market | Key Trends
- The B2B eCommerce landscape is witnessing a significant shift toward mobile commerce. Business buyers increasingly use smartphones and tablets to conduct transactions, research products, and manage their accounts. Mobile apps and responsive design have become essential tools for B2B platforms, enabling seamless and intuitive experiences on various devices.
- Personalization has become a cornerstone of B2B eCommerce strategies. Businesses leverage data analytics, AI, and machine learning to provide tailored customer experiences. B2B platforms can offer customized product recommendations, pricing structures, and content by analyzing past behaviors and preferences. This trend enhances customer engagement and loyalty by catering to individual needs and streamlining the purchasing process.
MARKET SEGMENTATION
Market Segmentation –Industry and Mode of Payment –
Market by Industry:
- Consumer Electronics
- Industrial & Science
- Automotive & Transportation
- Beauty & Personal Care
- Beauty & personal care is the fastest-growing industry in the global B2B eCommerce market.
- B2B eCommerce has reshaped the landscape of the beauty & personal care sector, introducing a transformative shift in how businesses within this industry engage, collaborate, and deliver products and services.
- As a sector deeply rooted in aesthetics, self-care, and consumer preferences, integrating digital platforms has paved the way for enhanced efficiency, customization, and accessibility.
- B2B platforms offer a seamless avenue for beauty & personal care businesses to procure ingredients, packaging materials, cosmetics, skincare products, and specialized equipment, alongside optimizing the procurement process and minimizing lead times.
- Clothing
- Sports
- Food & Beverage
- Building & Construction
- Other Industries
Market by Mode of Payment:
- Digital/Mobile/E-Wallets
- Credit & Debit Cards
- Bank Transfer
- Bank transfer is the dominating mode of payment in the global B2B eCommerce market.
- Bank transfers are becoming a popular online payment method. This is attributed to lower acceptance costs, fewer chargebacks for merchants, convenience for consumers, increasing banked populations in emerging markets, regulatory push from PSD2/Open Banking mandates, etc.
- Furthermore, significant developments are in place for bank transfers. For instance, in 2022, Bank of America announced its latest online payment solution, Pay by Bank, in conjunction with Banked Ltd. This new feature allows customers of eCommerce companies to pay directly from their bank account.
- Cash on Delivery
- Other Modes of Payment
GEOGRAPHICAL STUDY
Geographical Study Based On Four Major Regions:- North America: The United States and Canada
- Europe: The United Kingdom, Germany, France, Italy, Spain, Belgium, Poland, and Rest of Europe
- Asia-Pacific: China, Japan, India, South Korea, Indonesia, Thailand, Vietnam, Australia & New Zealand, and Rest of Asia-Pacific
- Asia-Pacific is the fastest-growing region in the global B2B eCommerce market.
- The region makes for a compelling market for B2B eCommerce, characterized by a diverse range of industries, cultures, and business practices.
- For instance, Asia-Pacific’s businesses are increasingly embracing digital transformation, leading to surging online transactions and rising adoption of innovative technological solutions.
- In addition to China, countries like India, Japan, South Korea, and Southeast Asian nations are experiencing a rapid shift towards B2B eCommerce. The proliferation of smartphones, the increasing internet connectivity, and the rising digital payment methods have catalyzed the growth of online trade in these markets.
- However, the diverse regulatory frameworks, varying levels of technological infrastructure, and cultural nuances present complexities. Additionally, data privacy and cybersecurity concerns underscore the importance of robust digital security measures.
- Rest of World: Latin America, Middle East & Africa
MAJOR PLAYERS
Some of the major players in the global B2B eCommerce market are:
- Alibaba Group Holding Ltd
- Amazon Inc
- eBay Inc
- DIYTrade
- EC21
- Kompass
Key strategies adopted by some of these companies:
- June 2022: Tech Data India, a subsidiary of TD SYNNEX, unveiled its B2B eCommerce platform, PEER CONNEXIONS. This innovative platform embodies the shift towards digital transformation in the industry, marking a significant step in the evolution of traditional business practices.
- March 2022: Larsen & Toubro introduced L&T-SuFin, an advanced B2B eCommerce platform. This platform offers a wide array of industrial products and services across 40+ categories, including essential areas like finance and logistics support, revolutionizing the B2B sector.
February 2022: Xeeva, a prominent AI-powered spend management and procurement software leader with a global reach, joined forces with IndusUno, a major B2B online marketplace in India. This partnership is geared towards facilitating the seamless buying and selling of industrial equipment and business supplies, creating a robust platform for streamlined transactions.
REPORT SYNOPSIS
| REPORT SCOPE | DETAILS |
|---|---|
| Market Forecast Years | 2023-2032 |
| Base Year | 2022 |
| Market Historical Years | 2018-2022 |
| Forecast Units | Revenue ($ Billion) |
| Segments Analyzed | Industry and Mode of Payment |
| Geographies Analyzed | North America, Europe, Asia-Pacific, and Rest of World |
| Companies Analyzed | Alibaba Group Holding Ltd, Amazon Inc, China-Asean Trade, DIYTrade, eBay Inc, EC21, eWorldTrade, Flexfire LEDs, Flipkart, Global Sources, IndiaMART InterMESH Ltd, Kompass, MSC Industrial Direct, Quill Lincolnshire Inc, Thomasnet |
TABLE OF CONTENT
RESEARCH SCOPE & METHODOLOGY
- STUDY OBJECTIVES
- METHODOLOGY
- ASSUMPTIONS & LIMITATIONS
EXECUTIVE SUMMARY
- MARKET SIZE & ESTIMATES
- MARKET OVERVIEW
- SCOPE OF STUDY
- CRISIS SCENARIO ANALYSIS
- IMPACT OF COVID-19 ON B2B ECOMMERCE MARKET
- MAJOR MARKET FINDINGS
- ENABLING SEAMLESS BUSINESS EVOLUTION THROUGH ONLINE PLATFORMS
- EMPOWERING 24/7 GLOBAL INTERACTIONS AND TRANSACTIONS
- OPTIMIZING OPERATIONS AND REDUCING OVERHEADS THROUGH E-COMMERCE
- EXPANDING MARKET HORIZONS AND UNLOCKING INTERNATIONAL OPPORTUNITIES
MARKET DYNAMICS
- KEY DRIVERS
- EXPANDING DIGITAL ORDERS
- TECHNOLOGICAL PROGRESS AND INNOVATIONS
- SEAMLESS USAGE AND ADOPTION OF DIVERSE PAYMENT METHODS
- KEY RESTRAINTS
- INCREASING EMPHASIS ON DATA PRIVACY AND SECURITY
- NEED FOR SUBSTANTIAL CAPITAL INVESTMENT
- KEY DRIVERS
KEY ANALYTICS
- KEY MARKET TRENDS
- PORTER’S FIVE FORCES ANALYSIS
- BUYERS POWER
- SUPPLIERS POWER
- SUBSTITUTION
- NEW ENTRANTS
- INDUSTRY RIVALRY
- GROWTH PROSPECT MAPPING
- GROWTH PROSPECT MAPPING FOR UNITED STATES
- GROWTH PROSPECT MAPPING FOR UNITED KINGDOM
- GROWTH PROSPECT MAPPING FOR INDIA
- GROWTH PROSPECT MAPPING FOR MIDDLE EAST & AFRICA
- MARKET MATURITY ANALYSIS
- MARKET CONCENTRATION ANALYSIS
MARKET BY INDUSTRY
- CONSUMER ELECTRONICS
- MARKET FORECAST FIGURE
- SEGMENT ANALYSIS
- INDUSTRIAL & SCIENCE
- MARKET FORECAST FIGURE
- SEGMENT ANALYSIS
- AUTOMOTIVE & TRANSPORTATION
- MARKET FORECAST FIGURE
- SEGMENT ANALYSIS
- BEAUTY & PERSONAL CARE
- MARKET FORECAST FIGURE
- SEGMENT ANALYSIS
- CLOTHING
- MARKET FORECAST FIGURE
- SEGMENT ANALYSIS
- SPORTS
- MARKET FORECAST FIGURE
- SEGMENT ANALYSIS
- FOOD & BEVERAGE
- MARKET FORECAST FIGURE
- SEGMENT ANALYSIS
- BUILDING & CONSTRUCTION
- MARKET FORECAST FIGURE
- SEGMENT ANALYSIS
- OTHER INDUSTRIES
- MARKET FORECAST FIGURE
- SEGMENT ANALYSIS
- CONSUMER ELECTRONICS
MARKET BY MODE OF PAYMENT
- DIGITAL/MOBILE/E-WALLETS
- MARKET FORECAST FIGURE
- SEGMENT ANALYSIS
- CREDIT & DEBIT CARDS
- MARKET FORECAST FIGURE
- SEGMENT ANALYSIS
- BANK TRANSFER
- MARKET FORECAST FIGURE
- SEGMENT ANALYSIS
- CASH ON DELIVERY
- MARKET FORECAST FIGURE
- SEGMENT ANALYSIS
- OTHER MODES OF PAYMENT
- MARKET FORECAST FIGURE
- SEGMENT ANALYSIS
- DIGITAL/MOBILE/E-WALLETS
GEOGRAPHICAL ANALYSIS
- NORTH AMERICA
- MARKET SIZE & ESTIMATES
- NORTH AMERICA B2B ECOMMERCE MARKET DRIVERS
- NORTH AMERICA B2B ECOMMERCE MARKET CHALLENGES
- KEY PLAYERS IN NORTH AMERICA B2B ECOMMERCE MARKET
- COUNTRY ANALYSIS
- UNITED STATES
- UNITED STATES B2B ECOMMERCE MARKET SIZE & OPPORTUNITIES
- CANADA
- CANADA B2B ECOMMERCE MARKET SIZE & OPPORTUNITIES
- UNITED STATES
- EUROPE
- MARKET SIZE & ESTIMATES
- EUROPE B2B ECOMMERCE MARKET DRIVERS
- EUROPE B2B ECOMMERCE MARKET CHALLENGES
- KEY PLAYERS IN EUROPE B2B ECOMMERCE MARKET
- COUNTRY ANALYSIS
- UNITED KINGDOM
- UNITED KINGDOM B2B ECOMMERCE MARKET SIZE & OPPORTUNITIES
- GERMANY
- GERMANY B2B ECOMMERCE MARKET SIZE & OPPORTUNITIES
- FRANCE
- FRANCE B2B ECOMMERCE MARKET SIZE & OPPORTUNITIES
- ITALY
- ITALY B2B ECOMMERCE MARKET SIZE & OPPORTUNITIES
- SPAIN
- SPAIN B2B ECOMMERCE MARKET SIZE & OPPORTUNITIES
- BELGIUM
- BELGIUM B2B ECOMMERCE MARKET SIZE & OPPORTUNITIES
- POLAND
- POLAND B2B ECOMMERCE MARKET SIZE & OPPORTUNITIES
- REST OF EUROPE
- REST OF EUROPE B2B ECOMMERCE MARKET SIZE & OPPORTUNITIES
- UNITED KINGDOM
- ASIA-PACIFIC
- MARKET SIZE & ESTIMATES
- ASIA-PACIFIC B2B ECOMMERCE MARKET DRIVERS
- ASIA-PACIFIC B2B ECOMMERCE MARKET CHALLENGES
- KEY PLAYERS IN ASIA-PACIFIC B2B ECOMMERCE MARKET
- COUNTRY ANALYSIS
- CHINA
- CHINA B2B ECOMMERCE MARKET SIZE & OPPORTUNITIES
- JAPAN
- JAPAN B2B ECOMMERCE MARKET SIZE & OPPORTUNITIES
- INDIA
- INDIA B2B ECOMMERCE MARKET SIZE & OPPORTUNITIES
- SOUTH KOREA
- SOUTH KOREA B2B ECOMMERCE MARKET SIZE & OPPORTUNITIES
- INDONESIA
- INDONESIA B2B ECOMMERCE MARKET SIZE & OPPORTUNITIES
- THAILAND
- THAILAND B2B ECOMMERCE MARKET SIZE & OPPORTUNITIES
- VIETNAM
- VIETNAM B2B ECOMMERCE MARKET SIZE & OPPORTUNITIES
- AUSTRALIA & NEW ZEALAND
- AUSTRALIA & NEW ZEALAND B2B ECOMMERCE MARKET SIZE & OPPORTUNITIES
- REST OF ASIA-PACIFIC
- REST OF ASIA-PACIFIC B2B ECOMMERCE MARKET SIZE & OPPORTUNITIES
- CHINA
- REST OF WORLD
- MARKET SIZE & ESTIMATES
- REST OF WORLD B2B ECOMMERCE MARKET DRIVERS
- REST OF WORLD B2B ECOMMERCE MARKET CHALLENGES
- KEY PLAYERS IN REST OF WORLD B2B ECOMMERCE MARKET
- REGIONAL ANALYSIS
- LATIN AMERICA
- LATIN AMERICA B2B ECOMMERCE MARKET SIZE & OPPORTUNITIES
- MIDDLE EAST & AFRICA
- MIDDLE EAST & AFRICA B2B ECOMMERCE MARKET SIZE & OPPORTUNITIES
- LATIN AMERICA
- NORTH AMERICA
COMPETITIVE LANDSCAPE
- KEY STRATEGIC DEVELOPMENTS
- PRODUCT LAUNCHES & DEVELOPMENTS
- PARTNERSHIPS & AGREEMENTS
- COMPANY PROFILES
- ALIBABA GROUP HOLDING LTD
- COMPANY OVERVIEW
- PRODUCTS / SERVICES LIST
- STRENGTHS & CHALLENGES
- AMAZON INC
- COMPANY OVERVIEW
- PRODUCTS / SERVICES LIST
- STRENGTHS & CHALLENGES
- CHINAASEAN TRADE
- COMPANY OVERVIEW
- PRODUCTS / SERVICES LIST
- STRENGTHS & CHALLENGES
- DIY TRADE
- COMPANY OVERVIEW
- PRODUCTS / SERVICES LIST
- STRENGTHS & CHALLENGES
- EBAY INC
- COMPANY OVERVIEW
- PRODUCTS / SERVICES LIST
- STRENGTHS & CHALLENGES
- EC21
- COMPANY OVERVIEW
- PRODUCTS / SERVICES LIST
- STRENGTHS & CHALLENGES
- EWORLDTRADE
- COMPANY OVERVIEW
- PRODUCTS / SERVICES LIST
- STRENGTHS & CHALLENGES
- FLEXFIRE LEDS
- COMPANY OVERVIEW
- PRODUCTS / SERVICES LIST
- STRENGTHS & CHALLENGES
- FLIPKART
- COMPANY OVERVIEW
- PRODUCTS / SERVICES LIST
- STRENGTHS & CHALLENGES
- GLOBAL SOURCES
- COMPANY OVERVIEW
- PRODUCTS / SERVICES LIST
- STRENGTHS & CHALLENGES
- INDIAMART INTERMESH LTD
- COMPANY OVERVIEW
- PRODUCTS / SERVICES LIST
- STRENGTHS & CHALLENGES
- KOMPASS
- COMPANY OVERVIEW
- PRODUCTS / SERVICES LIST
- STRENGTHS & CHALLENGES
- MSC INDUSTRIAL DIRECT
- COMPANY OVERVIEW
- PRODUCTS / SERVICES LIST
- STRENGTHS & CHALLENGES
- QUILL LINCOLNSHIRE INC
- COMPANY OVERVIEW
- PRODUCTS / SERVICES LIST
- STRENGTHS & CHALLENGES
- THOMASNET
- COMPANY OVERVIEW
- PRODUCTS / SERVICES LIST
- STRENGTHS & CHALLENGES
- ALIBABA GROUP HOLDING LTD
- KEY STRATEGIC DEVELOPMENTS
LIST OF TABLES
TABLE 1: MARKET SNAPSHOT – B2B ECOMMERCE
TABLE 2: GLOBAL B2B ECOMMERCE MARKET, BY INDUSTRY, HISTORICAL YEARS, 2018-2022 (IN $ BILLION)
TABLE 3: GLOBAL B2B ECOMMERCE MARKET, BY INDUSTRY, FORECAST YEARS, 2023-2032 (IN $ BILLION)
TABLE 4: GLOBAL CONSUMER ELECTRONICS MARKET, BY REGION, HISTORICAL YEARS, 2018-2022 (IN $ BILLION)
TABLE 5: GLOBAL CONSUMER ELECTRONICS MARKET, BY REGION, FORECAST YEARS, 2023-2032 (IN $ BILLION)
TABLE 6: GLOBAL INDUSTRIAL & SCIENCE MARKET, BY REGION, HISTORICAL YEARS, 2018-2022 (IN $ BILLION)
TABLE 7: GLOBAL INDUSTRIAL & SCIENCE MARKET, BY REGION, FORECAST YEARS, 2023-2032 (IN $ BILLION)
TABLE 8: GLOBAL AUTOMOTIVE & TRANSPORTATION MARKET, BY REGION, HISTORICAL YEARS, 2018-2022 (IN $ BILLION)
TABLE 9: GLOBAL AUTOMOTIVE & TRANSPORTATION MARKET, BY REGION, FORECAST YEARS, 2023-2032 (IN $ BILLION)
TABLE 10: GLOBAL BEAUTY & PERSONAL CARE MARKET, BY REGION, HISTORICAL YEARS, 2018-2022 (IN $ BILLION)
TABLE 11: GLOBAL BEAUTY & PERSONAL CARE MARKET, BY REGION, FORECAST YEARS, 2023-2032 (IN $ BILLION)
TABLE 12: GLOBAL CLOTHING MARKET, BY REGION, HISTORICAL YEARS, 2018-2022 (IN $ BILLION)
TABLE 13: GLOBAL CLOTHING MARKET, BY REGION, FORECAST YEARS, 2023-2032 (IN $ BILLION)
TABLE 14: GLOBAL SPORTS MARKET, BY REGION, HISTORICAL YEARS, 2018-2022 (IN $ BILLION)
TABLE 15: GLOBAL SPORTS MARKET, BY REGION, FORECAST YEARS, 2023-2032 (IN $ BILLION)
TABLE 16: GLOBAL FOOD & BEVERAGE MARKET, BY REGION, HISTORICAL YEARS, 2018-2022 (IN $ BILLION)
TABLE 17: GLOBAL FOOD & BEVERAGE MARKET, BY REGION, FORECAST YEARS, 2023-2032 (IN $ BILLION)
TABLE 18: GLOBAL BUILDING & CONSTRUCTION MARKET, BY REGION, HISTORICAL YEARS, 2018-2022 (IN $ BILLION)
TABLE 19: GLOBAL BUILDING & CONSTRUCTION MARKET, BY REGION, FORECAST YEARS, 2023-2032 (IN $ BILLION)
TABLE 20: GLOBAL OTHER INDUSTRIES MARKET, BY REGION, HISTORICAL YEARS, 2018-2022 (IN $ BILLION)
TABLE 21: GLOBAL OTHER INDUSTRIES MARKET, BY REGION, FORECAST YEARS, 2023-2032 (IN $ BILLION)
TABLE 22: GLOBAL B2B ECOMMERCE MARKET, BY MODE OF PAYMENT, HISTORICAL YEARS, 2018-2022 (IN $ BILLION)
TABLE 23: GLOBAL B2B ECOMMERCE MARKET, BY MODE OF PAYMENT, FORECAST YEARS, 2023-2032 (IN $ BILLION)
TABLE 24: GLOBAL DIGITAL/MOBILE/E-WALLETS MARKET, BY REGION, HISTORICAL YEARS, 2018-2022 (IN $ BILLION)
TABLE 25: GLOBAL DIGITAL/MOBILE/E-WALLETS MARKET, BY REGION, FORECAST YEARS, 2023-2032 (IN $ BILLION)
TABLE 26: GLOBAL CREDIT & DEBIT CARDS MARKET, BY REGION, HISTORICAL YEARS, 2018-2022 (IN $ BILLION)
TABLE 27: GLOBAL CREDIT & DEBIT CARDS MARKET, BY REGION, FORECAST YEARS, 2023-2032 (IN $ BILLION)
TABLE 28: GLOBAL BANK TRANSFER MARKET, BY REGION, HISTORICAL YEARS, 2018-2022 (IN $ BILLION)
TABLE 29: GLOBAL BANK TRANSFER MARKET, BY REGION, FORECAST YEARS, 2023-2032 (IN $ BILLION)
TABLE 30: GLOBAL CASH ON DELIVERY MARKET, BY REGION, HISTORICAL YEARS, 2018-2022 (IN $ BILLION)
TABLE 31: GLOBAL CASH ON DELIVERY MARKET, BY REGION, FORECAST YEARS, 2023-2032 (IN $ BILLION)
TABLE 32: GLOBAL OTHER MODES OF PAYMENT MARKET, BY REGION, HISTORICAL YEARS, 2018-2022 (IN $ BILLION)
TABLE 33: GLOBAL OTHER MODES OF PAYMENT MARKET, BY REGION, FORECAST YEARS, 2023-2032 (IN $ BILLION)
TABLE 34: GLOBAL B2B ECOMMERCE MARKET, BY GEOGRAPHY, HISTORICAL YEARS, 2018-2022 (IN $ BILLION)
TABLE 35: GLOBAL B2B ECOMMERCE MARKET, BY GEOGRAPHY, FORECAST YEARS, 2023-2032 (IN $ BILLION)
TABLE 36: NORTH AMERICA B2B ECOMMERCE MARKET, BY COUNTRY, HISTORICAL YEARS, 2018-2022 (IN $ BILLION)
TABLE 37: NORTH AMERICA B2B ECOMMERCE MARKET, BY COUNTRY, FORECAST YEARS, 2023-2032 (IN $ BILLION)
TABLE 38: KEY PLAYERS OPERATING IN NORTH AMERICA B2B ECOMMERCE MARKET
TABLE 39: EUROPE B2B ECOMMERCE MARKET, BY COUNTRY, HISTORICAL YEARS, 2018-2022 (IN $ BILLION)
TABLE 40: EUROPE B2B ECOMMERCE MARKET, BY COUNTRY, FORECAST YEARS, 2023-2032 (IN $ BILLION)
TABLE 41: KEY PLAYERS OPERATING IN EUROPE B2B ECOMMERCE MARKET
TABLE 42: ASIA-PACIFIC B2B ECOMMERCE MARKET, BY COUNTRY, HISTORICAL YEARS, 2018-2022 (IN $ BILLION)
TABLE 43: ASIA-PACIFIC B2B ECOMMERCE MARKET, BY COUNTRY, FORECAST YEARS, 2023-2032 (IN $ BILLION)
TABLE 44: KEY PLAYERS OPERATING IN ASIA-PACIFIC B2B ECOMMERCE MARKET
TABLE 45: REST OF WORLD B2B ECOMMERCE MARKET, BY REGION, HISTORICAL YEARS, 2018-2022 (IN $ BILLION)
TABLE 46: REST OF WORLD B2B ECOMMERCE MARKET, BY REGION, FORECAST YEARS, 2023-2032 (IN $ BILLION)
TABLE 47: KEY PLAYERS OPERATING IN REST OF WORLD B2B ECOMMERCE MARKET
TABLE 48: LIST OF PRODUCT LAUNCHES & DEVELOPMENTS
TABLE 49: LIST OF PARTNERSHIPS & AGREEMENTS
LIST OF FIGURES
FIGURE 1: KEY MARKET TRENDS
FIGURE 2: PORTER’S FIVE FORCES ANALYSIS
FIGURE 3: GROWTH PROSPECT MAPPING FOR UNITED STATES
FIGURE 4: GROWTH PROSPECT MAPPING FOR UNITED KINGDOM
FIGURE 5: GROWTH PROSPECT MAPPING FOR INDIA
FIGURE 6: GROWTH PROSPECT MAPPING FOR MIDDLE EAST & AFRICA
FIGURE 7: MARKET MATURITY ANALYSIS
FIGURE 8: MARKET CONCENTRATION ANALYSIS
FIGURE 9: GLOBAL B2B ECOMMERCE MARKET, GROWTH POTENTIAL, BY INDUSTRY, IN 2022
FIGURE 10: GLOBAL B2B ECOMMERCE MARKET, BY CONSUMER ELECTRONICS, 2023-2032 (IN $ BILLION)
FIGURE 11: GLOBAL B2B ECOMMERCE MARKET, BY INDUSTRIAL & SCIENCE, 2023-2032 (IN $ BILLION)
FIGURE 12: GLOBAL B2B ECOMMERCE MARKET, BY AUTOMOTIVE & TRANSPORTATION, 2023-2032 (IN $ BILLION)
FIGURE 13: GLOBAL B2B ECOMMERCE MARKET, BY BEAUTY & PERSONAL CARE, 2023-2032 (IN $ BILLION)
FIGURE 14: GLOBAL B2B ECOMMERCE MARKET, BY CLOTHING, 2023-2032 (IN $ BILLION)
FIGURE 15: GLOBAL B2B ECOMMERCE MARKET, BY SPORTS, 2023-2032 (IN $ BILLION)
FIGURE 16: GLOBAL B2B ECOMMERCE MARKET, BY FOOD & BEVERAGE, 2023-2032 (IN $ BILLION)
FIGURE 17: GLOBAL B2B ECOMMERCE MARKET, BY BUILDING & CONSTRUCTION, 2023-2032 (IN $ BILLION)
FIGURE 18: GLOBAL B2B ECOMMERCE MARKET, BY OTHER INDUSTRIES, 2023-2032 (IN $ BILLION)
FIGURE 19: GLOBAL B2B ECOMMERCE MARKET, GROWTH POTENTIAL, BY MODE OF PAYMENT, IN 2022
FIGURE 20: GLOBAL B2B ECOMMERCE MARKET, BY DIGITAL/MOBILE/E-WALLETS, 2023-2032 (IN $ BILLION)
FIGURE 21: GLOBAL B2B ECOMMERCE MARKET, BY CREDIT & DEBIT CARDS, 2023-2032 (IN $ BILLION)
FIGURE 22: GLOBAL B2B ECOMMERCE MARKET, BY BANK TRANSFER, 2023-2032 (IN $ BILLION)
FIGURE 23: GLOBAL B2B ECOMMERCE MARKET, BY CASH ON DELIVERY, 2023-2032 (IN $ BILLION)
FIGURE 24: GLOBAL B2B ECOMMERCE MARKET, BY OTHER MODES OF PAYMENT, 2023-2032 (IN $ BILLION)
FIGURE 25: NORTH AMERICA B2B ECOMMERCE MARKET, COUNTRY OUTLOOK, 2022 & 2032 (IN %)
FIGURE 26: UNITED STATES B2B ECOMMERCE MARKET, 2023-2032 (IN $ BILLION)
FIGURE 27: CANADA B2B ECOMMERCE MARKET, 2023-2032 (IN $ BILLION)
FIGURE 28: EUROPE B2B ECOMMERCE MARKET, COUNTRY OUTLOOK, 2022 & 2032 (IN %)
FIGURE 29: UNITED KINGDOM B2B ECOMMERCE MARKET, 2023-2032 (IN $ BILLION)
FIGURE 30: GERMANY B2B ECOMMERCE MARKET, 2023-2032 (IN $ BILLION)
FIGURE 31: FRANCE B2B ECOMMERCE MARKET, 2023-2032 (IN $ BILLION)
FIGURE 32: ITALY B2B ECOMMERCE MARKET, 2023-2032 (IN $ BILLION)
FIGURE 33: SPAIN B2B ECOMMERCE MARKET, 2023-2032 (IN $ BILLION)
FIGURE 34: BELGIUM B2B ECOMMERCE MARKET, 2023-2032 (IN $ BILLION)
FIGURE 35: POLAND B2B ECOMMERCE MARKET, 2023-2032 (IN $ BILLION)
FIGURE 36: REST OF EUROPE B2B ECOMMERCE MARKET, 2023-2032 (IN $ BILLION)
FIGURE 37: ASIA-PACIFIC B2B ECOMMERCE MARKET, COUNTRY OUTLOOK, 2022 & 2032 (IN %)
FIGURE 38: CHINA B2B ECOMMERCE MARKET, 2023-2032 (IN $ BILLION)
FIGURE 39: JAPAN B2B ECOMMERCE MARKET, 2023-2032 (IN $ BILLION)
FIGURE 40: INDIA B2B ECOMMERCE MARKET, 2023-2032 (IN $ BILLION)
FIGURE 41: SOUTH KOREA B2B ECOMMERCE MARKET, 2023-2032 (IN $ BILLION)
FIGURE 42: INDONESIA B2B ECOMMERCE MARKET, 2023-2032 (IN $ BILLION)
FIGURE 43: THAILAND B2B ECOMMERCE MARKET, 2023-2032 (IN $ BILLION)
FIGURE 44: VIETNAM B2B ECOMMERCE MARKET, 2023-2032 (IN $ BILLION)
FIGURE 45: AUSTRALIA & NEW ZEALAND B2B ECOMMERCE MARKET, 2023-2032 (IN $ BILLION)
FIGURE 46: REST OF ASIA-PACIFIC B2B ECOMMERCE MARKET, 2023-2032 (IN $ BILLION)
FIGURE 47: REST OF WORLD B2B ECOMMERCE MARKET, REGIONAL OUTLOOK, 2022 & 2032 (IN %)
FIGURE 48: LATIN AMERICA B2B ECOMMERCE MARKET, 2023-2032 (IN $ BILLION)
FIGURE 49: MIDDLE EAST & AFRICA B2B ECOMMERCE MARKET, 2023-2032 (IN $ BILLION)
FAQ’s
FAQs
The Asia-Pacific B2B ecommerce market was valued at $15421.90 billion in 2022.
Consumer electronics had the largest market share of around 19% in 2022.
Mobile ecommerce revolution, personalization and customer centricity, B2B marketplace emerging as central hubs for conducting transactions, and connecting buyers and suppliers from various industries on a single platform are the key market trends in the global B2B eCommerce market.
RELATED REPORTS
-
GLOBAL CONSUMER VIDEO FEEDBACK SOFTWARE MARKET FORECAST 2024-2032
-
GLOBAL AI TRAINING DATASET MARKET FORECAST 2024-2032
-
GLOBAL PRODUCTIVITY MANAGEMENT SOFTWARE MARKET FORECAST 2024-2032
-
CHINA PRODUCTIVITY MANAGEMENT SOFTWARE MARKET FORECAST 2024-2032
-
UNITED KINGDOM PRODUCTIVITY MANAGEMENT SOFTWARE MARKET FORECAST 2024-2032
-
UNITED STATES PRODUCTIVITY MANAGEMENT SOFTWARE MARKET FORECAST 2024-2032
-
GLOBAL SPORTS ANALYTICS MARKET FORECAST 2024-2032
-
ASIA-PACIFIC SPORTS ANALYTICS MARKET FORECAST 2024-2032
-
EUROPE SPORTS ANALYTICS MARKET FORECAST 2024-2032
-
NORTH AMERICA SPORTS ANALYTICS MARKET FORECAST 2024-2032