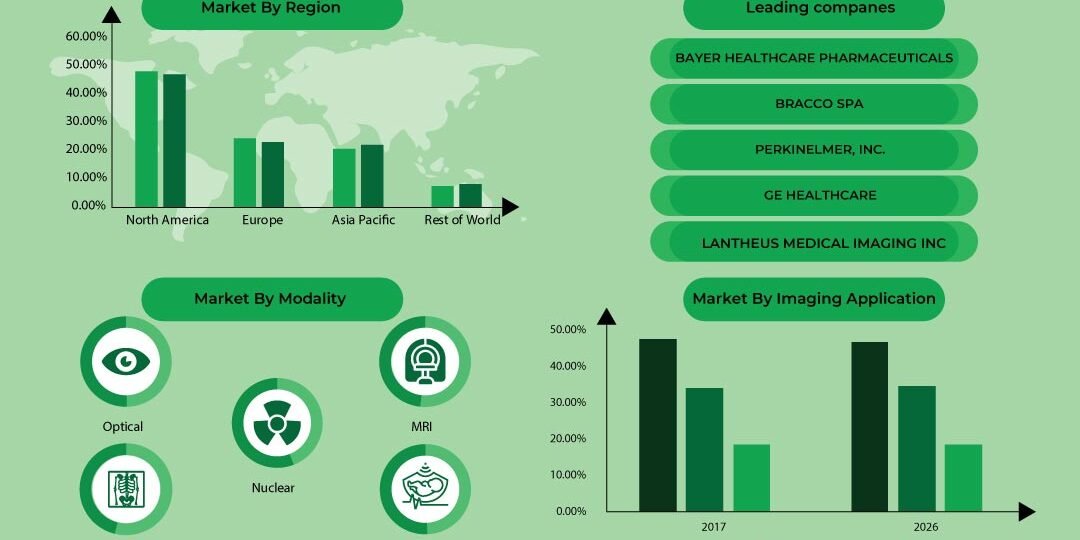
The global biological imaging reagents market is anticipated to grow from $20,380 million in 2026 to $33,210 million by 2032, at a CAGR of 8.34% between 2026 and 2032. Biologic imaging reagents play a fundamental role in today’s medical, pharmaceutical and biotechnological industries. Optical imaging reagents allow life sciences researchers and drug developers to visualize and detect biological processes at the molecular level and to perform key genomics, proteomics, and cellular analysis assays.
GLOBAL BIOLOGICAL IMAGING REAGENT MARKET FORECAST 2026
Biological Imaging Reagent Market by (Class, Technology, End User, Application, End-use, Modality) & Geography
Where the growth actually is. The action has moved to spatial and multiplexed imaging. More than 65% of leading translational research institutions now run multiplex panels with 5–12 markers, up from under 30% five years ago, demand for spatial biology solutions has risen over 70%, and more than 45% of oncology clinical trials now build multiplex immunofluorescence imaging into sample evaluation. The multiplex biomarker imaging segment itself is small but fast — around USD 0.54 billion in 2025 rising to USD 0.60 billion in 2026 at 10.8%.

To know more about this report, request a free sample copy
The Biological Imaging market is primarily driven by the following factors:
- Increase in the demand for imaging technologies
- Increased accessibility to cutting edge laser eye medication
- Development of newer, targeted imaging agents and expansion of imaging technologies
The important driver increasing growth in the global Biological Imaging Market is increasing demand for imaging technologies. Advances in technologies that are used in biologic imaging reagents are also moving forward at a rapid pace. These technologies include nanotechnology, biologic targeting, microfluidics, supramolecular chemistry and protein engineering. Rapid developments across a number of technology fields promise to change the biological imaging industry by enabling novel imaging reagents and unique market opportunities.
The applications and technologies of biological imaging market are used extensively for various purposes. Contrast imaging can be used to study many organs and structures in your body. Optical imaging is a technique for noninvasive visualization of the inside of the body, as is done with x-rays. Nuclear medicine is a division of medicinal imaging that uses small quantities of radioactive substantials to determine and diagnose the sternness or extravagance a diversity, of diseases. Small chemicals molecules are small molecular masses that include second messengers, monosaccharides, lipids, other natural products, and metabolites. Probes include organic dyes, which may also be conjugated with various biochemicals that include proteins, antibodies or oligonucleotides. A radioactive label, or radioactive tracer, is a chemical composite in which single or many atoms have been substituted by a radioisotope. By feature of its radioactive deterioration, it can be used to discover the machinery of chemical responses by outlining the track that the radioisotope trails from reactants to products. Chelation allows metals to be conveyed to and fro from susceptible target locates and facilitates or hinders their carcinogenic potential. The distinctive capability of micro bubbles to retort to ultrasound sorts those valuable mediators for molecular imaging, contrast ultrasound imaging, and targeted gene delivery and drug. Nanoparticle is a tiny element with at best one dimension fewer than 100 nm.
Technological and scientific advances increasing the cost of reagents and the need for less toxic/hazardous reagents are the major factors hindering the biological imaging market. Technological and scientific advances along with the increasing understanding of the basic mechanisms of disease are raising the development of latest drugs and cures for patients. But at the same time, complexities and cost of biopharmaceutical research have also increased, which is hampering the research and development process. A trend affecting the growth of specific market segments within imaging reagents is driving the need for less toxic/hazardous reagents.
The Global Biological Imaging market segments include class, technologies, end users, end use, modality, and applications.
The class is segmented into:
- Contrast reagents
- Optical reagents
- Nuclear reagents
Technologies are segmented into:
- Small chemicals
- Probes
- Radiotracers
- Chelating molecules
- Micro bubbles
- Fluorescent proteins
- Nanoparticles
End Users are segmented into:
- Diagnostics
- Research and development
End-Use is segmented into:
- In-vivo
- In-vitro
Modality is segmented into:
- Optical
- X-ray/CT
- Nuclear
- MRI
- Ultrasound
Applications are segmented into:
- Contrast imaging
- Optical imaging
- Radioactive imaging
This report covers the present market conditions and the growth prospects of the global Biological Imaging market for 2017-2025 and considered the revenue generated through the sales of Biological Imaging for Class, Technologies, End Users, End Use, Modality and Applications
Geographically, the Global Biological Imaging market has been segmented on the basis of four major regions, which include:
- North America – U.S. & Canada
- Asia-Pacific – China, India, Japan, Rest of APAC
- Europe – UK, France, Germany, Rest of Europe
- Rest of World- Latin America, Middle East and North Africa, Rest of Africa
North America holds roughly 35.7% of the bio-imaging market in 2026 and over 41% of multiplex biomarker imaging revenue in 2025. Asia-Pacific is the fastest-growing region. The U.S. and Canada are the major regions which help to drive the market of Biological Imaging Reagents in North America. The U.S. held the largest market share with a total of 78% in 2026. The growing pharmaceutical industry, surging government funding in life science-based research, and rising demand for GMO crops are pushing the market of Biological Imaging Reagents in the U.S. On the other hand, Rest of World is anticipated to be the fastest-growing region for the Biological Imaging market. The increasing healthcare investment and rising market of biotechnology-based industries are the major factors helping to increase the market for bio-imaging reagents in the forecast period 2017-2025. Latin America, Middle East, and North Africa are some of the other major regions of the world which help to fuel the market for bio-imaging reagents, globally in the forecast period.
The Biological Imaging Reagents Market is segmented on the basis of Class, sub-divided into contrast reagents, optical reagents, and nuclear reagents; on the basis of Technology, sub-divided into fluorescent dyes and probes, fluorescent proteins, quantum dots, radiopharmaceuticals, and nanoparticles; on the basis of Application, sub-divided into in-vivo and in-vitro; on the basis of End-Use, sub-divided into clinical diagnostics and research and development; on the basis of End User, sub-divided into diagnostic laboratories, imaging centres, life sciences companies, and academic and research institutes; and on the basis of Modality, sub-divided into Optical, X-ray/CT, Nuclear, MRI, Ultrasound, and Multimodal.
Contrast reagents are divided into two categories. The first consists of paramagnetic compounds, including lanthanides such as gadolinium, and the second consists of superparamagnetic nanoparticles (SPMNPs) such as iron oxides. Optical reagents include fluorescent dyes and probes, fluorescent proteins, quantum dots, and bioluminescent substrates used in fluorescence microscopy, bioluminescence imaging, and near-infrared imaging. Nuclear reagents include imaging radiopharmaceuticals used in PET and SPECT, which emit positrons or gamma radiation detectable by specialised imaging equipment and report on metabolic and physiological processes.
Diagnostic imaging refers to a variety of non-invasive methods for identifying and monitoring diseases or injuries via the generation of images. The research and development segment includes drug discovery and development as well as government, academic and institutional research. In vivo denotes research performed inside a living organism. In vitro refers to performing a given procedure in a controlled environment outside a living organism. Optical imaging is an emerging technology with significant potential for improving disease prevention, diagnosis, and treatment in the medical office, at the bedside, or in the operating room. X-rays are a form of electromagnetic radiation. Nuclear medicine is a branch of medical imaging that uses radiopharmaceuticals to examine the function and structure of organs and tissues. MRI uses strong magnetic fields and radiofrequency pulses to generate detailed soft-tissue images, with contrast enhanced by paramagnetic agents. Ultrasound uses high-frequency sound waves, with microbubble contrast agents improving vascular and perfusion visualisation. Multimodal reagents combine two or more detection mechanisms in a single agent, allowing a single injection to serve complementary modalities.
The major market players of the Global Biological Imaging Reagents market are:
- Bayer AG
- Bracco Imaging S.p.A.
- Cardinal Health, Inc.
- Curium Pharma
- GE HealthCare Technologies Inc.
- Guerbet Group
- Lantheus Holdings, Inc.
- Novartis AG (Advanced Accelerator Applications)
- Revvity, Inc.
- Siemens Healthineers AG
- Thermo Fisher Scientific Inc.
- Becton
Company Profiles covers analysis of important players.
Bayer HealthCare Pharmaceuticals (Bayer Pharma or ‘the company’), formerly known as Bayer Schering Pharma, is a pharmaceuticals business arm of Bayer. It is a global research-based company engaged in the development, manufacture, and marketing of specialty-focused medicines, primarily in the therapeutic areas of cardiology, oncology, gynecology, hematology, and ophthalmology. Bayer Pharma was created through the merger of Bayer and Schering in 2006. It operates through its subsidiaries in more than 100 countries spread across Europe, the Americas, Asia Pacific, Africa and the Middle East.
Key Findings of the Global Biological Imaging market:
- North America is the market leader
- High market growth rate for nuclear imaging reagents by class
- SPECT and PET imaging reagent is a rapidly growing segment of the pharmaceutical industry
- Research and development is the fastest growing end-user segment
- RESEARCH SCOPE
- STUDY GOALS
- SCOPE OF THE MARKET STUDY
- WHO WILL FIND THIS REPORT USEFUL?
- STUDY AND FORECASTING YEARS
- RESEARCH METHODOLOGY
- SOURCES OF DATA
- SECONDARY DATA
- PRIMARY DATA
- TOP DOWN APPROACH
- BOTTOM-UP APPROACH
- DATA TRIANGULATION
- SOURCES OF DATA
- EXECUTIVE SUMMARY
- MARKET SUMMARY
- KEY FINDINGS
- NORTH AMERICA IS THE MARKET LEADER
- HIGH MARKET GROWTH RATE FOR NUCLEAR IMAGING REAGENTS BY CLASS
- SPECT AND PET IMAGING REAGENT IS A RAPIDLY GROWING SEGMENT FOR THE PHARMACEUTICAL INDUSTRY
- RESEARCH AND DEVELOPMENT IS THE FASTEST GROWING END-USER SEGMENT
- MARKET DETERMINANTS
- DRIVERS
- INCREASE IN THE DEMAND FOR IMAGING TECHNOLOGIES
- INCREASED ACCESSIBILITY TO CUTTING EDGE LASER EYE MEDICATION
- DEVELOPMENT OF NEWER, TARGETED IMAGING AGENTS AND EXPANSION OF IMAGING TECHNOLOGIES
- RESTRAINTS
- TECHNOLOGICAL AND SCIENTIFIC ADVANCES INCREASES THE COST OF REAGENTS
- NEED FOR LESS TOXIC/HAZARDOUS REAGENTS
- OPPORTUNITIES
- RESEARCH IN ENVIRONMENTAL BIOTECHNOLOGY
- DEVELOPMENT OF PIVOTAL INNOVATIONS
- CHALLENGES
- DIFFERENCES IN REGULATIONS
- DRIVERS
- MARKET SEGMENTATION
- BY CLASS
- CONTRAST REAGENTS
- OPTICAL REAGENTS
- NUCLEAR REAGENTS
- BY TECHNOLOGY
- SMALL CHEMICALS
- PROBES
- RADIOTRACERS
- CHELATING MOLECULES
- MICRO BUBBLES
- FLUORESCENT PROTEINS
- NANOPARTICLES
- BY END USER
- DIAGNOSTICS
- RESEARCH AND DEVELOPMENT
- BY APPLICATION
- CONTRAST IMAGING
- OPTICAL IMAGING
- IN-VITRO
- PROTEOMICS
- GENOMICS
- CELL BIOLOGY
- IN-VIVO
- IN-VITRO
- RADIOACTIVE IMAGING
- BY END-USE
- IN-VIVO
- IN-VITRO
- BY MODALITY
- OPTICAL
- X-RAY/CT
- NUCLEAR
- SPECT
- PET
- MRI
- ULTRASOUND
- BY CLASS
- KEY ANALYTICAL
- PORTER’S FIVE FORCE MODEL
- THREAT OF NEW ENTRANTS
- THREAT OF SUBSTITUTE PRODUCTS OR SERVICES
- BARGAINING POWER OF BUYER
- BARGAINING POWER OF SUPPLIER
- INTENSITY OF COMPETITIVE RIVALRY
- PARAMETRIC ANALYSIS
- BIOTECHNOLOGY FIRMS ACROSS COUNTRIES
- GLOBAL PHARMACEUTICAL RESEARCH & DEVELOPMENT EXPENDITURE
- KEY BUYING CRITERIA
- SUSTAINABILITY
- QUALITY OF PRODUCT
- COST
- AVAILABILITY
- PORTER’S FIVE FORCE MODEL
- GEOGRAPHICAL ANALYSIS
- NORTH AMERICA
- UNITED STATES
- CANADA
- EUROPE
- UNITED KINGDOM
- FRANCE
- GERMANY
- REST OF EUROPE
- ASIA PACIFIC
- CHINA
- INDIA
- JAPAN
- REST OF ASIA PACIFIC
- REST OF THE WORLD
- LATIN AMERICA
- MIDDLE EAST AND NORTH AFRICA
- REST OF AFRICA
- NORTH AMERICA
- COMPANY PROFILES
- BAYER HEALTHCARE
- BECKMAN-COULTER
- BRACCO
- EVIDENT TECHNOLOGIES
- GE HEALTHCARE
- JUBILANT ORGANOSYS
- LANTHEUS MEDICAL IMAGING
- LIFE TECHNOLOGIES
- SCHERING AG
- SIEMENS MEDICAL
LIST OF TABLES
TABLE 1 GLOBAL BIOLOGICAL IMAGING REAGENTS MARKET, BY GEOGRAPHY 2017-2025 ($ MILLION)
TABLE 2 GLOBAL BIOLOGICAL IMAGING REAGENTS MARKET, BY CLASS 2017-2025 ($ MILLION)
TABLE 3 GLOBAL BIOLOGICAL IMAGING REAGENTS MARKET, BY TECHNOLOGY 2017-2025 ($ MILLION)
TABLE 4 GLOBAL MICROBUBBLES MARKET 2017-2025 ($ MILLION)
TABLE 5 GLOBAL BIOLOGICAL IMAGING REAGENTS MARKET, BY END USER 2017-2025 ($ MILLION)
TABLE 6 GLOBAL BIOLOGICAL IMAGING REAGENTS MARKET, BY APPLICATION 2017-2025 ($ MILLION)
TABLE 7 GLOBAL OPTICAL IMAGING MARKET 2017-2025 ($ MILLION)
TABLE 8 GLOBAL INVITRO OPTICAL IMAGING MARKET 2017-2025 ($ MILLION)
TABLE 9 GLOBAL PROTEOMICS MARKET 2017-2025 ($ MILLION)
TABLE 10 GLOBAL GENOMICS MARKET 2017-2025 ($ MILLION)
TABLE 11 GLOBAL CELL BIOLOGY MARKET 2017-2025 ($ MILLION)
TABLE 12 GLOBAL BIOLOGICAL IMAGING REAGENTS MARKET, BY END USE 2017-2025 ($ MILLION)
TABLE 13 GLOBAL BIOLOGICAL IMAGING REAGENTS MARKET, BY MODALITY 2017-2025 ($ MILLION)
TABLE 14 GLOBAL X-RAY/CT TYPE MARKET 2017-2025 ($ MILLION)
TABLE 15 GLOBAL X-RAY/CT INDICATION MARKET 2017-2025 ($ MILLION)
TABLE 16 GLOBAL NUCLEAR ISOTOPE MARKET 2017-2025 ($ MILLION)
TABLE 17 GLOBAL NUCLEAR INDICATION MARKET 2017-2025 ($ MILLION)
TABLE 18 GLOBAL NUCLEAR TECHNOLOGY MARKET 2017-2025 ($ MILLION)
TABLE 19 GLOBAL SPECT ISOTOPE MARKET 2017-2025 ($ MILLION)
TABLE 20 GLOBAL SPECT INDICATION MARKET 2017-2025 ($ MILLION)
TABLE 21 GLOBAL SPECT TECHNOLOGY MARKET 2017-2025 ($ MILLION)
TABLE 22 GLOBAL PET ISOTOPE MARKET 2017-2025 ($ MILLION)
TABLE 23 GLOBAL PET INDICATION MARKET 2017-2025 ($ MILLION)
TABLE 24 GLOBAL PET TECHNOLOGY MARKET 2017-2025 ($ MILLION)
TABLE 25 GLOBAL BIOLOGICAL IMAGING REAGENTS MARKET BY GEOGRAPHY 2017-2025 ($ MILLION)
TABLE 26 NORTH AMERICA BIOLOGICAL IMAGING REAGENTS MARKET 2017-2025 ($ MILLION)
TABLE 27 EUROPE BIOLOGICAL IMAGING REAGENTS MARKET 2017-2025 ($ MILLION)
TABLE 28 ASIA PACIFIC BIOLOGICAL IMAGING REAGENTS MARKET 2017-2025 ($ MILLION)
TABLE 29 REST OF THE WORLD BIOLOGICAL IMAGING REAGENTS MARKET 2017-2025 ($ MILLION)
LIST OF FIGURES
FIGURE # 1 NUMBER OF CANCER CASES AROUND THE WORLD (IN MILLION)
FIGURE # 2 INCIDENCE OF PEOPLE WITH HIV
FIGURE # 3 GLOBAL GERIATRIC POPULATION (65+) 2015 & 2020 (MILLION)
FIGURE # 4 YOUNG CHILDREN AND OLDER PEOPLE AS A PERCENTAGE OF GLOBAL POPULATION 1950-2050
FIGURE # 5 TOTAL HEALTH EXPENDITURE PER CAPITA IN US DOLLARS
FIGURE # 6 NUMBER OF HOSPITALS (2015)
FIGURE # 7 GLOBAL INSTRUMENT MARKET 2017-2025 ($MILLION)
FIGURE # 8 GLOBAL REAGENTS & CONSUMABLES MARKET 2017-2025 ($MILLION)
FIGURE # 9 GLOBAL SOFTWARE & SERVICES MARKET 2017-2025 ($MILLION)
FIGURE # 10 GLOBAL CLINICAL MARKET 2017-2025 ($MILLION)
FIGURE # 11 TOTAL US MEDICAL AND HEALTH R&D SPENDING ($MILLION)
FIGURE # 12 GLOBAL RESEARCH MARKET 2017-2025 ($MILLION)
FIGURE # 13 GLOBAL FORENSIC MARKET 2017-2025 ($MILLION)
FIGURE # 14 ACADEMIC AND RESEARCH INSTITUTION FUND IN USA ($MILLION)
FIGURE # 15 GLOBAL RESEARCH LABORATORY AND ACADEMIC INSTITUTES MARKET 2017-2025 ($MILLION)
FIGURE # 16 GLOBAL PHARMACEUTICAL AND BIOTECHNOLOGICAL COMPANIES MARKET 2017-2025 ($MILLION)
FIGURE # 17 GLOBAL CLINICAL RESEARCH ORGANIZATION MARKET 2017-2025 ($MILLION)
FIGURE # 18 GLOBAL FORENSIC LABORATORIES MARKET 2017-2025 ($MILLION)
FIGURE # 19 GROWTH OF THE COUNTRIES CAGR FOR THE FORECASTED PERIOD 2017-2025
FIGURE # 20 APAC REVENUE GROWTH 2017-2025 ($MILLION)
FIGURE # 21 POPULATION OF NORTH AMERICA 2016 (MILLION)
FIGURE # 22 PERCENT OF POPULATION WITH AGE
FIGURE # 23 UNITED STATES (U.S.) DIGITAL PCR MARKET 2017-2025 ($MILLION)
FIGURE # 24 NUMBER OF PERSONS 65+, 2014 TO 2023 (NO. IN MILLIONS)
FIGURE # 25 CANADA DIGITAL PCR MARKET 2017-2025 ($MILLION)
FIGURE # 26 ESTIMATES OF POPULATION, BY AGE GROUP AND SEX
FIGURE # 27 EUROPE DIGITAL PCR MARKET
FIGURE # 28 UNITED KINGDOM (UK) DIGITAL PCR MARKET 2017-2025 ($MILLION)
FIGURE # 29 GLOBAL MEN AND WOMEN CANCER MORTALITY 2016
FIGURE # 30 GERMANY DIGITAL PCR MARKET 2017-2025 ($MILLION)
FIGURE # 31 SPAIN DIGITAL PCR MARKET 2017-2025 ($MILLION)
FIGURE # 32 REST OF EUROPE DIGITAL PCR MARKET 2017-2025 ($MILLION)
FIGURE # 33 INDIA DIGITAL PCR MARKET 2017-2025 ($MILLION)
FIGURE # 34 CANCER INCIDENCE RATE IN ASIAN COUNTRIES BY GENDER 2016
FIGURE # 35 CHINA DIGITAL PCR MARKET 2017-2025 ($MILLION)
FIGURE # 36 JAPAN LIFE EXPECTANCY RATE 2013-2015 (IN YEARS)
FIGURE # 37 JAPAN DIGITAL PCR MARKET 2017-2025 ($MILLION)
FIGURE # 38 ROAPAC DIGITAL PCR MARKET 2017-2025 ($MILLION)
FIGURE # 41 LATIN AMERICA DIGITAL PCR MARKET 2017-2025 ($MILLION)
FIGURE # 42 MIDDLE EAST AND AFRICA DIGITAL PCR MARKET 2017-2025 ($MILLION)
FIGURE # 45 MARKET SHARE ANALYSIS OF KEY PLAYERS IN DIGITAL PCR MARKET 2016
FIGURE 1 GLOBAL BIOLOGICAL IMAGING REAGENTS MARKET 2017-2025 ($ MILLION)
FIGURE 2 GLOBAL CONTRAST REAGENTS MARKET 2017-2025 ($ MILLION)
FIGURE 3 GLOBAL OPTICALREAGENTS MARKET 2017-2025 ($ MILLION)
FIGURE 4 GLOBAL NUCLEAR REAGENTS MARKET 2017-2025 ($ MILLION)
FIGURE 5 GLOBAL SMALL CHEMICALS MARKET 2017-2025 ($ MILLION)
FIGURE 6 GLOBAL PROBES MARKET 2017-2025 ($ MILLION)
FIGURE 7 GLOBAL RADIOTRACERS MARKET 2017-2025 ($ MILLION)
FIGURE 8 GLOBAL CHELATING MOLECULES MARKET 2017-2025 ($ MILLION)
FIGURE 9 GLOBAL MICRO BUBBLES MARKET 2017-2025 ($ MILLION)
FIGURE 10 GLOBAL FLUORESCENT PROTEINS MARKET 2017-2025 ($ MILLION)
FIGURE 11 GLOBAL NANOPARTICLES MARKET 2017-2025 ($ MILLION)
FIGURE 12 GLOBAL DIAGNOSTICS MARKET 2017-2025 ($ MILLION)
FIGURE 13 GLOBAL RESEARCH AND DEVELOPMENT MARKET 2017-2025 ($ MILLION)
FIGURE 14 GLOBAL CONTRAST IMAGING MARKET 2017-2025 ($ MILLION)
FIGURE 15 GLOBAL OPTICAL IMAGING MARKET 2017-2025 ($ MILLION)
FIGURE 16 GLOBAL PROTEOMICS MARKET 2017-2025 ($ MILLION)
FIGURE 17 GLOBAL GENOMICS MARKET 2017-2025 ($ MILLION)
FIGURE 18 GLOBAL CELL BIOLOGY MARKET 2017-2025 ($ MILLION)
FIGURE 19 GLOBAL INVIVO MARKET 2017-2025 ($ MILLION)
FIGURE 20 GLOBAL RADIOACTIVE IMAGING MARKET 2017-2025 ($ MILLION)
FIGURE 21 GLOBAL IN-VIVO MARKET 2017-2025 ($ MILLION)
FIGURE 22 GLOBAL IN-VITRO MARKET 2017-2025 ($ MILLION)
FIGURE 23 GLOBAL OPTICAL MARKET 2017-2025 ($ MILLION)
FIGURE 24 GLOBAL X-RAY/CT MARKET 2017-2025 ($ MILLION)
FIGURE 25 GLOBAL NUCLEAR MARKET 2017-2025 ($ MILLION)
FIGURE 26 GLOBAL SPECT MARKET 2017-2025 ($ MILLION)
FIGURE 27 GLOBAL PET MARKET 2017-2025 ($ MILLION)
FIGURE 28 GLOBAL MRI MARKET 2017-2025 ($ MILLION)
FIGURE 29 GLOBAL ULTRASOUND MARKET 2017-2025 ($ MILLION)
FIGURE 30 PORTER’S FIVE FORCE MODEL OF BIOLOGICAL IMAGING REGENTS MARKET
FIGURE 31 BIOTECHNOLOGY FIRMS ACROSS COUNTRIES 2016
FIGURE 32 WORLDWIDE TOTAL PHARMACEUTICAL R&D EXPENDITURE 2015-2020 ($ BILLION)
FIGURE 33 KEY BUYING FACTORS OF BIOLOGICAL IMAGING REAGENTS 2017-2025
FIGURE 34 NORTH AMERICA BIOLOGICAL IMAGING REAGENTS MARKET 2017-2025 ($ MILLION)
FIGURE 35 UNITED STATES BIOLOGICAL IMAGING REAGENTS MARKET 2017-2025 ($ MILLION)
FIGURE 36 CANADA BIOLOGICAL IMAGING REAGENTS MARKET 2017-2025 ($ MILLION)
FIGURE 37 UNITED KINGDOM BIOLOGICAL IMAGING REAGENTS MARKET 2017-2025 ($ MILLION)
FIGURE 38 FRANCE BIOLOGICAL IMAGING REAGENTS MARKET 2017-2025 ($ MILLION)
FIGURE 39 MORTALITY RATE DUE TO CHRONIC DISEASES IN FRANCE
FIGURE 40 GERMANY BIOLOGICAL IMAGING REAGENTS MARKET 2017-2025 ($ MILLION)
FIGURE 41 BIOTECHNOLOGY APPLICATIONS IN GERMANY
FIGURE 42 REST OF EUROPE BIOLOGICAL IMAGING REAGENTS MARKET 2017-2025 ($ MILLION)
FIGURE 43 CHINA BIOLOGICAL IMAGING REAGENTS MARKET 2017-2025 ($ MILLION)
FIGURE 44 INDIA BIOLOGICAL IMAGING REAGENTS MARKET 2017-2025 ($ MILLION)
FIGURE 45 JAPAN BIOLOGICAL IMAGING REAGENTS MARKET 2017-2025 ($ MILLION)
FIGURE 46 APPLICATION OF JAPANESE BIOTECHNOLOGY
FIGURE 47 REST OF ASIA PACIFIC BIOLOGICAL IMAGING REAGENTS MARKET 2017-2025 ($ MILLION)
FIGURE 48 LATIN AMERICA BIOLOGICAL IMAGING REAGENTS MARKET 2017-2025 ($ MILLION)
FIGURE 49 MIDDLE EAST AND NORTH AFRICA BIOLOGICAL IMAGING REAGENTS MARKET 2017-2025 ($ MILLION)
FIGURE 50 REST OF AFRICA BIOLOGICAL IMAGING REAGENTS MARKET 2017-2025 ($ MILLION)
- MARKET SEGMENTATION
- BY CLASS
- CONTRAST REAGENTS
- OPTICAL REAGENTS
- NUCLEAR REAGENTS
- BY TECHNOLOGY
- SMALL CHEMICALS
- PROBES
- RADIOTRACERS
- CHELATING MOLECULES
- MICRO BUBBLES
- FLUORESCENT PROTEINS
- NANOPARTICLES
- BY END USER
- DIAGNOSTICS
- RESEARCH AND DEVELOPMENT
- BY APPLICATION
- CONTRAST IMAGING
- OPTICAL IMAGING
- IN-VITRO
- PROTEOMICS
- GENOMICS
- CELL BIOLOGY
- IN-VIVO
- IN-VITRO
- RADIOACTIVE IMAGING
- BY END-USE
- IN-VIVO
- IN-VITRO
- BY MODALITY
- OPTICAL
- X-RAY/CT
- NUCLEAR
- SPECT
- PET
- MRI
- ULTRASOUND
- BY CLASS
- GEOGRAPHICAL ANALYSIS
- NORTH AMERICA
- UNITED STATES
- CANADA
- EUROPE
- UNITED KINGDOM
- FRANCE
- GERMANY
- REST OF EUROPE
- ASIA PACIFIC
- CHINA
- INDIA
- JAPAN
- REST OF ASIA PACIFIC
- REST OF THE WORLD
- LATIN AMERICA
- MIDDLE EAST AND NORTH AFRICA
- REST OF AFRICA
- NORTH AMERICA