
MALAYSIA LIQUEFIED NATURAL GAS (LNG) MARKET
Natural gas is a fossil fuel majorly comprising of methane. As with other fossil fuels, it is formed deep beneath the earth’s surface due to the decomposition of dead plants and animals under extreme heat and pressures. Natural gas is cleaner than most other fossilized fuels. However, its calorific value is lower than the fossil fuels like petrol, diesel, and LPG.

To learn more about this report, request a free sample copy
Malaysia is considered the second-largest producer of oil and natural gas in Southeast Asia. It is the fifth-largest LNG (liquefied natural gas) exporter in the world as of 2019. It is quite strategically located on the most important routes that exist specifically for seaborne energy trading. The key major importers of Malaysia’s LNG, as of 2019, are based in the Asia-Pacific region. Japan, China, and South Korea are the three largest importers. The total proved reserves of the country as of 2020 are 2.7 trillion cubic meters. This forms 0.4% of the global total proved reserves.
LNG and LPG (liquid petroleum gas), a by-product of oil refining, have supplemented oil as one of the main energy sources. The oil produced in Malaysia is quite light. It has a low sulfur content and is sold at a premium price in export markets. This is done to counterbalance its imports of heavy oils to manufacture various petroleum products for its domestic use. Most Malaysian oil and gas are in the EEX (exclusive economic zone), located in the South China Sea. Most of the LNG found offshore of the states of Sabah and Sarawak is located south of the South China Sea.
However, in certain areas where transportation using pipelines is not possible, liquefying natural gas is a way to transport cost-effectively. Natural gas is cooled to about -260 degrees Fahrenheit to form Liquefied Natural Gas, i.e., LNG. The volume reduction is to the tune of 600 times the original.
The history of Malaysia as a major LNG producer began in 1960 with the discovery of numerous gas reserves, specifically in the Central Luconia basin of Sarawak, about 125 km away from Bintulu. On 31st March 1978, PETRONAS (Petroliam Nasional Bhd) signed a joint venture agreement with Shell BV, Mitsubishi Corporation, and the Sarawak government and initiated the country’s first LNG project.
The town of Bintulu, situated on the island of Borneo, Malaysia, was selected as the ideal site because of its strategic location along with the proper geographical condition that was later used for developing Sarawak’s first deep seaport, for catering to the other large LNG ships that had been called to the port in the later years.
The top LNG companies in the country are Petroliam Nasional Bhd (Petronas), Shell B.V., Mitsubishi Corporation, etc.
To request a free sample copy of this report, please complete the form below:
We offer 10% free customization including country-level data, niche applications and competitive landscape with every report.
- MALAYSIA LNG MARKET: EXECUTIVE SUMMARY
- MALAYSIA OVERALL ECONOMIC CONDITIONS
- MALAYSIA PRIMARY ENERGY CONSUMPTION
- NATURAL GAS
- MALAYSIA NATURAL GAS TOTAL PROVED RESERVES, PRODUCTION, AND CONSUMPTION
- TOTAL PROVED RESERVES
- NATURAL GAS PRODUCTION
- NATURAL GAS CONSUMPTION
- MALAYSIA NATURAL GAS TOTAL PROVED RESERVES, PRODUCTION, AND CONSUMPTION
- LIQUIFIED NATURAL GAS (LNG)
- VALUE CHAIN ANALYSIS
- EXPLORATION AND PRODUCTION
- LIQUEFACTION
- SHIPPING
- STORAGE AND REGASIFICATION
- TRADE
- EXPORTS
- IMPORTS
- LNG TERMINALS
- LIST OF LNG EXPORT TERMINALS
- LIST OF LNG IMPORT TERMINALS
- REGULATORY FRAMEWORK FOR LNG
- VALUE CHAIN ANALYSIS
LIST OF TABLES
TABLE 1: MALAYSIA NATURAL GAS TOTAL PROVED RESERVES, 2000, 2010, AND 2020 (IN TRILLION CUBIC METERS)
TABLE 2: MALAYSIA NATURAL GAS PRODUCTION, 2016-2020 (IN EXAJOULES)
TABLE 3: MALAYSIA NATURAL GAS CONSUMPTION, 2016-2020 (IN EXAJOULES)
TABLE 4: MALAYSIA LNG EXPORTS, 2016-2020 (IN BILLION CUBIC METERS)
TABLE 5: MALAYSIA LNG IMPORTS, 2016-2020 (IN BILLION CUBIC METERS)
TABLE 6: LNG EXPORT TERMINALS, EXISTING
TABLE 7: LNG IMPORT TERMINALS, EXISTING
TABLE 8: REGULATORY FRAMEWORK
LIST OF FIGURES
FIGURE 1: MALAYSIA GROSS DOMESTIC PRODUCT, 2016-2020 ($ BILLION)
FIGURE 2: PRIMARY ENERGY CONSUMPTION, BY FUEL TYPES, 2019 & 2020 (IN %)
FIGURE 3: PRIMARY ENERGY CONSUMPTION, 2016-2020 (EXAJOULES)
FIGURE 4: MALAYSIA NATURAL GAS PRODUCTION VS CONSUMPTION, 2016-2020 (IN EXAJOULES)
FIGURE 5: VALUE CHAIN ANALYSIS
MALAYSIA GROSS DOMESTIC PRODUCT, 2016-2020, ($ BILLION)
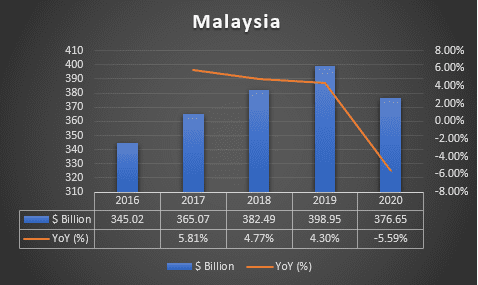
GDP (constant 2010 US$)
Source: World Bank
To request a free sample copy of this report, please complete the form below :
We offer 10% free customization including country-level data, niche applications and competitive landscape with every report.