
IRAN LIQUEFIED NATURAL GAS (LNG) MARKET
Natural gas is a fossil fuel majorly comprising methane. As with other fossil fuels, it is formed deep beneath the earth’s surface due to the decomposition of dead plants and animals under extreme heat and pressures. Natural gas is cleaner than the majority of other fossilized fuels. However, its calorific value is lower than fossil fuels such as petrol, diesel, LPG. Liquified natural gas (LNG) is compressed natural gas at -290 degrees, useful for transportation and heat generation.
To learn more about this report, request a free sample copy
The geographic location of the country is a key factor accredited to the development of the natural gas trade in Iran. According to EIA, the Strait of Hormuz, where the 20% worldwide fuel trade passes through, has become a major driver of growth for natural gas exploration in the country.
Iran ranks second in terms of total proved natural gas reserves. The country also doubled its production of natural gas from 2009 to 2019 without foreign investments, classified as a notable characteristic of the country. On account of the international sanction on Iran for oil production, the benefits have been witnessed in natural gas production, as well.
Iran is the fourth largest consumer of natural gas, following the United States, Russia, and China. Since 2018, domestic companies have continued working in natural gas fields in Iran. However, the storage of natural gas in liquid form due to the lack of storage capacity has been problematic.
The use of LNG in Iran is mainly concentrated in the production of electricity. While the residential and commercial sector consumes 35% of LNG, the industry share and LNG used for electricity accounted for 27% and 26%, respectively.
With a profound history of using natural gas, the first estimated natural gas production in Iran dates back to 1908-1912, when oil was discovered in Iranian land by the British. Until 1960, the proper usage of LNG was not explicitly noticed by the world, and as a result, natural gas has been stored in the country since then. Furthermore, the first commercial use of natural gas in the country was recorded in 1962 by Consortium.
The top LNG companies operating in the country are Kangan LNG, Iran LNG Corp, National Iran Gas Corp, etc.
To request a free sample copy of this report, please complete the form below:
We offer 10% free customization including country-level data, niche applications and competitive landscape with every report.
- IRAN LNG MARKET: EXECUTIVE SUMMARY
- IRAN OVERALL ECONOMIC CONDITIONS
- IRAN PRIMARY ENERGY CONSUMPTION
- NATURAL GAS
- IRAN NATURAL GAS TOTAL PROVED RESERVES, PRODUCTION, AND CONSUMPTION
- TOTAL PROVED RESERVES
- NATURAL GAS PRODUCTION
- NATURAL GAS CONSUMPTION
- IRAN NATURAL GAS TOTAL PROVED RESERVES, PRODUCTION, AND CONSUMPTION
- LIQUIFIED NATURAL GAS
- VALUE CHAIN ANALYSIS
- EXPLORATION AND PRODUCTION
- LIQUEFACTION
- SHIPPING
- STORAGE AND REGASIFICATION
- END-USERS
- FUTURE PROSPECTS OF LNG IN IRAN
- TRADE
- EXPORTS
- IMPORTS
- LNG TERMINALS
- LIST OF LNG EXPORT TERMINALS
- REGULATORY FRAMEWORK FOR LNG
- VALUE CHAIN ANALYSIS
LIST OF TABLES
TABLE 1: IRAN NATURAL GAS PRODUCTION, 2016-2020 (IN EXAJOULES)
TABLE 2: IRAN NATURAL GAS CONSUMPTION, 2016-2020 (IN EXAJOULES)
TABLE 3: ONGOING PIPELINE PROJECTS IN IRAN
TABLE 4: ONGOING LNG PROJECTS IN IRAN
TABLE 5: IRAN PIPELINE EXPORTS, 2016-2020 (IN BILLION CUBIC METERS)
TABLE 6: IRAN PIPELINE IMPORTS, 2016-2020 (IN BILLION CUBIC METERS)
TABLE 7: LNG EXPORT TERMINALS, EXISTING
TABLE 8: LNG EXPORT TERMINALS, NOT YET BUILT
TABLE 9: REGULATORY FRAMEWORK
LIST OF FIGURES
FIGURE 1: IRAN GROSS DOMESTIC PRODUCT, 2016-2020 ($ BILLION)
FIGURE 2: PRIMARY ENERGY CONSUMPTION, BY FUEL TYPES, 2019 & 2020 (IN %)
FIGURE 3: PRIMARY ENERGY CONSUMPTION, 2016-2020, (EXAJOULES)
FIGURE 4: IRAN NATURAL GAS TOTAL PROVED RESERVES, 2000, 2010, AND 2020 (IN TRILLION CUBIC METERS)
FIGURE 5: IRAN NATURAL GAS PRODUCTION VS CONSUMPTION, 2016-2020 (IN EXAJOULES)
FIGURE 6: VALUE CHAIN ANALYSIS
IRAN GROSS DOMESTIC PRODUCT, 2016-2020, ($ BILLION)
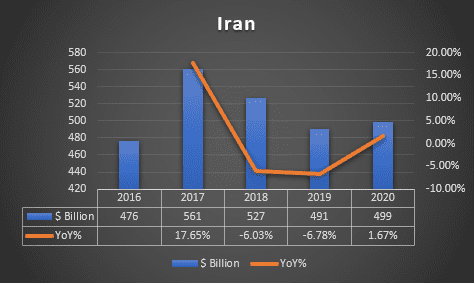
GDP (constant 2010 US$)
Source: World Bank
To request a free sample copy of this report, please complete the form below :
We offer 10% free customization including country-level data, niche applications and competitive landscape with every report.