
EUROPE CARBON DIOXIDE MARKET FORECAST 2020-2028
Europe Carbon Dioxide Market by Source (Ethyl Alcohol, Ethylene Oxide, Hydrogen, Substitute Natural Gas, Other Sources) by Application (Oil & Gas, Food & Beverages, Medical, Rubber, Firefighting, Other Applications) and by Geography.
The Europe carbon dioxide market is evaluated to project a CAGR of 2.85% in terms of revenue during the forecast period, 2020-2028. Also, the market is expected to grow at a CAGR of 2.59% in terms of volume. The considerable increase in the total output of oil production in the region is one of the primary factors influencing the market growth.
To learn more about this report, request a free sample copy
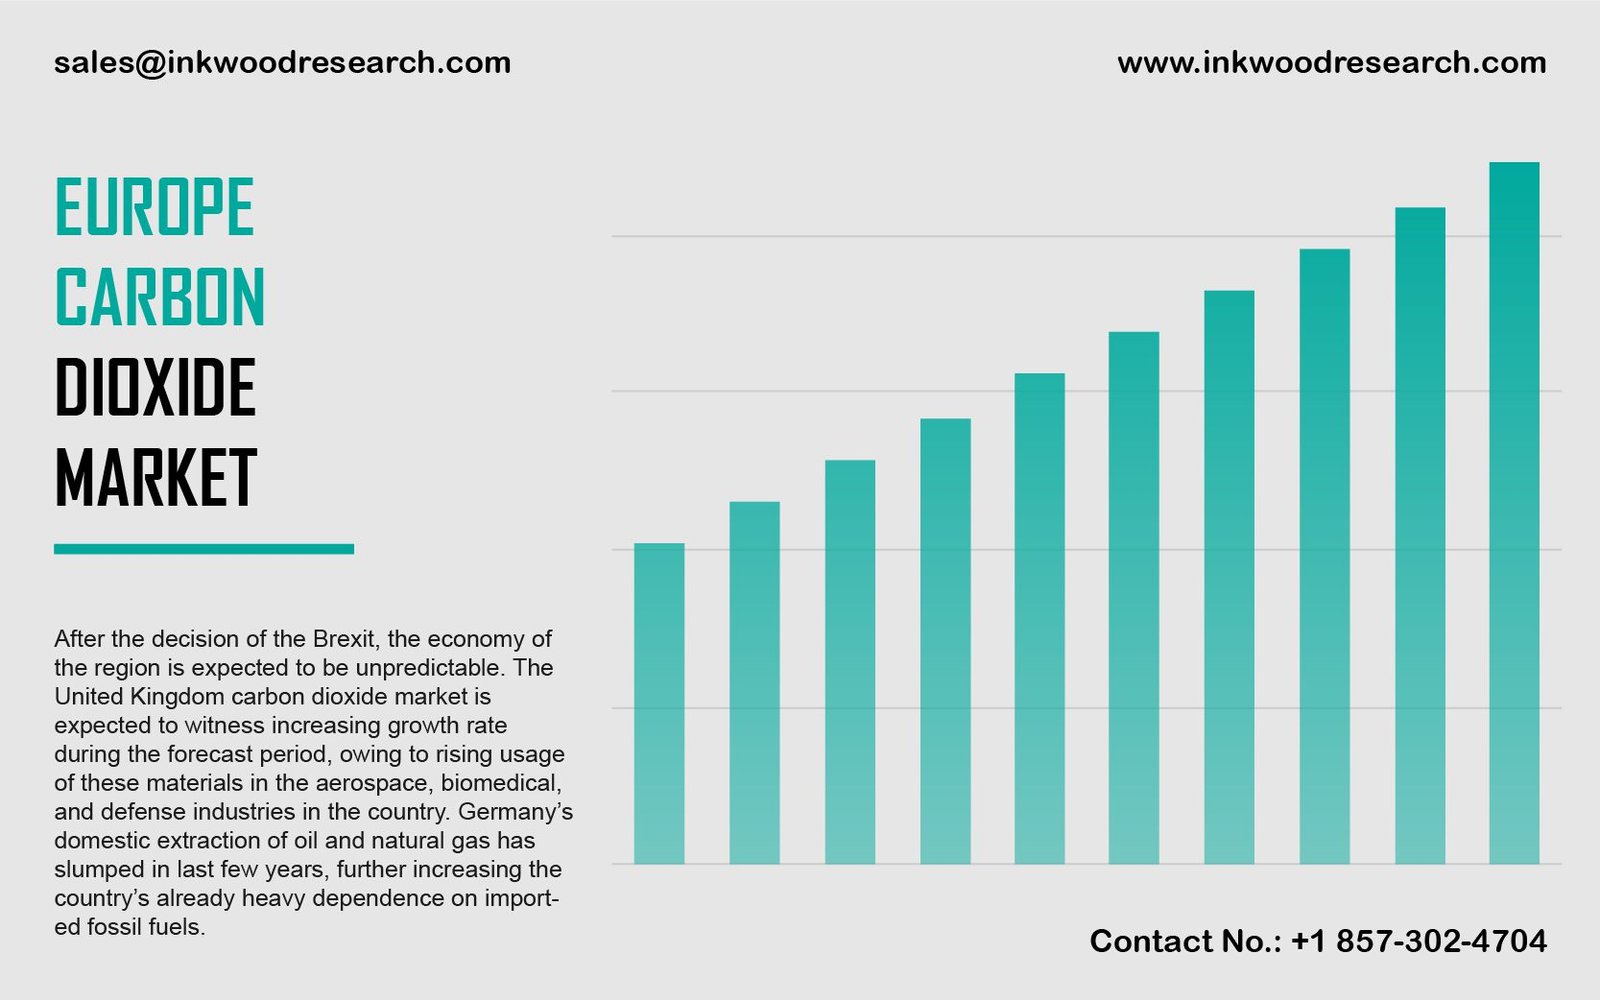
The Europe carbon dioxide market growth is further analyzed on the basis of the markets in Germany, the UK, France, Belgium, Russia, Italy, Poland, and the rest of Europe. The UK market is expected to witness growth due to the increasing use of carbon dioxide in the aerospace, defense, and biomedical industry. The energy industry has grown rapidly in the last decade, owing to increasing concerns for renewable and new energy sources for long sustainable growth. In 2018, oil production was 4% more in comparison to 2017, and 20% higher than in 2014. Germany’s GDP is the fourth largest in the world. The increased public consumption will influence the growth of the energy & power, electronics, automotive, chemical, and pharmaceutical industries, resulting in adding value to the growth of the market in the country. The growing wellness trend in Germany has led to the growth of healthy soft drinks
In countries like France and Italy, the market is expected to grow moderately during the forecast period. In France, the government has announced small and medium level jobs in order to deal with unemployment and increase productivity. This, in turn, is resulting in increased household consumption. Moreover, public investment has also increased in businesses, which is also favoring the growth of the country. In Italy, the future of the gas and oil industry is weak on account of rapidly depleting resources and existing restrictions on new exploration permits. Thus, the demand for carbon dioxide is slated to increase in the European region in the coming years, owing to its increasing application in various industries.
Linde AG is a global company functioning in the engineering and gas sector for over 140 years, and the company’s gas business comprises of industrial and medical gas.
To request a free sample copy of this report, please complete the form below:
We offer 10% free customization including country-level data, niche applications and competitive landscape with every report.
- RESEARCH SCOPE & METHODOLOGY
- STUDY OBJECTIVES
- SCOPE OF STUDY
- METHODOLOGY
- ASSUMPTIONS & LIMITATIONS
- EXECUTIVE SUMMARY
- MARKET SIZE & ESTIMATES `
- MARKET OVERVIEW
- MARKET DYNAMICS
- PARENT MARKET ANALYSIS: INDUSTRIAL GASES MARKET
- MARKET DEFINITION
- KEY DRIVERS
- RISING DEMAND FOR CARBONATED DRINKS
- CARBON DIOXIDE FLOODING FOR ENHANCED OIL RECOVERY
- RISE IN THE USE OF CARBON DIOXIDE IN MEDICAL INDUSTRY
- KEY RESTRAINTS
- COSTLY CARBON CAPTURE AND STORAGE TECHNOLOGY
- ENVIRONMENTAL IMPACT
- KEY ANALYTICS
- KEY INVESTMENT INSIGHTS
- PORTER’S FIVE FORCE ANALYSIS
- BUYER POWER
- SUPPLIER POWER
- SUBSTITUTION
- NEW ENTRANTS
- INDUSTRY RIVALRY
- OPPORTUNITY MATRIX
- VENDOR LANDSCAPE
- VALUE CHAIN ANALYSIS
- PESTEL ANALYSIS
- MARKET BY SOURCE
- ETHYL ALCOHOL
- ETHYLENE OXIDE
- HYDROGEN
- SUBSTITUTE NATURAL GAS
- OTHER SOURCES
- MARKET BY APPLICATION
- OIL & GAS
- FOOD & BEVERAGES
- MEDICAL
- RUBBER
- FIREFIGHTING
- OTHER APPLICATIONS
- GEOGRAPHICAL ANALYSIS
- EUROPE
- UNITED KINGDOM
- GERMANY
- FRANCE
- ITALY
- RUSSIA
- BELGIUM
- POLAND
- REST OF EUROPE
- EUROPE
- COMPANY PROFILES
- UNIVERSAL INDUSTRIAL GASES INC
- LINDE AG
- AIR PRODUCTS AND CHEMICALS INC
- INOX AIR PRODUCTS LTD
- AIRGAS INC
- CONTINENTAL CARBONIC PRODUCTS INC
- MATHESON TRI-GAS INC
- THE BOC GROUP
- AIR LIQUIDE SA
- COSMO ENGINEERING CO LTD
LIST OF TABLES
TABLE 1: MARKET SNAPSHOT – CARBON DIOXIDE
TABLE 2: EUROPE CARBON DIOXIDE MARKET, BY SOURCE, HISTORICAL YEARS, 2016-2019 (IN $ MILLION)
TABLE 3: EUROPE CARBON DIOXIDE MARKET, BY SOURCE, FORECAST YEARS, 2020-2028 (IN $ MILLION)
TABLE 4: EUROPE CARBON DIOXIDE MARKET, BY SOURCE, HISTORICAL YEARS, 2016-2019 (IN KILOTONS)
TABLE 5: EUROPE CARBON DIOXIDE MARKET, BY SOURCE, FORECAST YEARS, 2020-2028 (IN KILOTONS)
TABLE 6: EUROPE CARBON DIOXIDE MARKET, BY APPLICATION, HISTORICAL YEARS, 2016-2019 (IN $ MILLION)
TABLE 7: EUROPE CARBON DIOXIDE MARKET, BY APPLICATION, FORECAST YEARS, 2020-2028 (IN $ MILLION)
TABLE8: EUROPE CARBON DIOXIDE MARKET, BY APPLICATION, HISTORICAL YEARS, 2016-2019 (IN KILOTONS)
TABLE 9: EUROPE CARBON DIOXIDE MARKET, BY APPLICATION, FORECAST YEARS, 2020-2028 (IN KILOTONS)
TABLE 10: EUROPE CARBON DIOXIDE MARKET, BY COUNTRY, HISTORICAL YEARS, 2016-2019 (IN $ MILLION)
TABLE 11: EUROPE CARBON DIOXIDE MARKET, BY COUNTRY, FORECAST YEARS, 2020-2028 (IN $ MILLION)
TABLE 12: EUROPE CARBON DIOXIDE MARKET, BY COUNTRY, HISTORICAL YEARS, 2016-2019 (IN KILOTONS)
TABLE 13: EUROPE CARBON DIOXIDE MARKET, BY COUNTRY, FORECAST YEARS, 2020-2028 (IN KILOTONS)
LIST OF FIGURES
FIGURE 1: KEY INVESTMENT INSIGHTS
FIGURE 2: PORTER’S FIVE FORCE ANALYSIS
FIGURE 3: OPPORTUNITY MATRIX
FIGURE 4: VENDOR LANDSCAPE
FIGURE 5 VALUE CHANIN ANALYSIS
FIGURE 6 PESTEL ANALYSIS
FIGURE 7: EUROPE CARBON DIOXIDE MARKET, GROWTH POTENTIAL, BY SOURCE, IN 2019
FIGURE 8: EUROPE CARBON DIOXIDE MARKET, BY ETHYL ALCOHOL, 2020-2028 (IN $ MILLION)
FIGURE 9: EUROPE CARBON DIOXIDE MARKET, BY ETHYLENE OXIDE, 2020-2028 (IN $ MILLION)
FIGURE 10: EUROPE CARBON DIOXIDE MARKET, BY HYDROGEN, 2020-2028 (IN $ MILLION)
FIGURE 11: EUROPE CARBON DIOXIDE MARKET, BY SUBSTITUTE NATURAL GAS, 2020-2028 (IN $ MILLION)
FIGURE 12: EUROPE CARBON DIOXIDE MARKET, BY OTHER SOURCES, 2020-2028 (IN $ MILLION)
FIGURE 13: EUROPE CARBON DIOXIDE MARKET, GROWTH POTENTIAL, BY APPLICATION, IN 2019
FIGURE 14: EUROPE CARBON DIOXIDE MARKET, BY OIL & GAS, 2020-2028 (IN $ MILLION)
FIGURE 15: EUROPE CARBON DIOXIDE MARKET, BY FOOD & BEVERAGES, 2020-2028 (IN $ MILLION)
FIGURE 16: EUROPE CARBON DIOXIDE MARKET, BY MEDICAL APPLICATION, 2020-2028 (IN $ MILLION)
FIGURE 17: EUROPE CARBON DIOXIDE MARKET, BY RUBBER, 2020-2028 (IN $ MILLION)
FIGURE 18: EUROPE CARBON DIOXIDE MARKET, BY FIREFIGHTING, 2020-2028 (IN $ MILLION)
FIGURE 19: EUROPE CARBON DIOXIDE MARKET, BY OTHER APPLICATIONS, 2020-2028 (IN $ MILLION)
FIGURE 23: EUROPE CARBON DIOXIDE MARKET, REGIONAL OUTLOOK, 2019 & 2028 (IN %)
FIGURE 24: UNITED KINGDOM CARBON DIOXIDE MARKET, 2020-2028 (IN $ MILLION)
FIGURE 25: GERMANY CARBON DIOXIDE MARKET, 2020-2028 (IN $ MILLION)
FIGURE 26: FRANCE CARBON DIOXIDE MARKET, 2020-2028 (IN $ MILLION)
FIGURE 27: ITALY CARBON DIOXIDE MARKET, 2020-2028 (IN $ MILLION)
FIGURE 28: RUSSIA CARBON DIOXIDE MARKET, 2020-2028 (IN $ MILLION)
FIGURE 29: BELGIUM CARBON DIOXIDE MARKET, 2020-2028 (IN $ MILLION)
FIGURE 30: POLAND CARBON DIOXIDE MARKET, 2020-2028 (IN $ MILLION)
FIGURE 31: REST OF EUROPE CARBON DIOXIDE MARKET, 2020-2028 (IN $ MILLION)
- GEOGRAPHICAL ANALYSIS
- EUROPE
- UNITED KINGDOM
- GERMANY
- FRANCE
- ITALY
- RUSSIA
- BELGIUM
- POLAND
- REST OF EUROPE
- EUROPE
- MARKET BY SOURCE
- ETHYL ALCOHOL
- ETHYLENE OXIDE
- HYDROGEN
- SUBSTITUTE NATURAL GAS
- OTHER SOURCES
- MARKET BY APPLICATION
- OIL & GAS
- FOOD & BEVERAGES
- MEDICAL
- RUBBER
- FIREFIGHTING
- OTHER APPLICATIONS
To request a free sample copy of this report, please complete the form below :
We offer 10% free customization including country-level data, niche applications and competitive landscape with every report.