GLOBAL ENERGY RETROFIT SYSTEM MARKET FORECAST 2024-2032
SCOPE OF THE REPORT
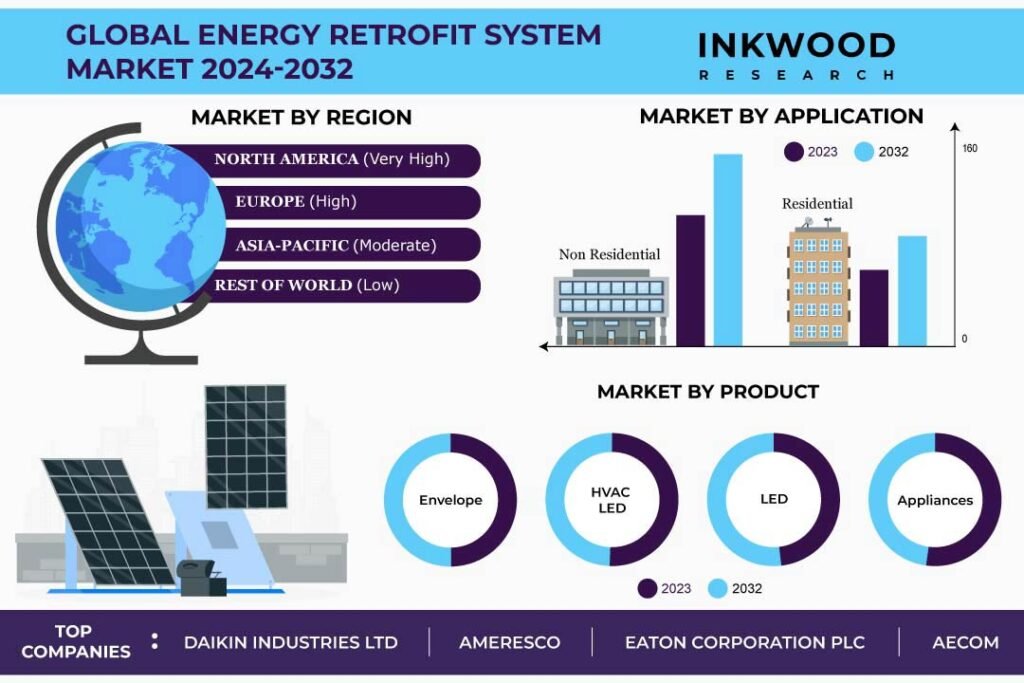
Global Energy Retrofit System Market by Type (Deep Retrofit, Quick Wins Retrofit) Market by Product (Envelope, LED Lighting, Appliances, HVAC) Market by Application (Residential, Institutional, Commercial) by Geography
REPORTS » ENERGY, POWER & UTILITIES » UTILITIES » GLOBAL ENERGY RETROFIT SYSTEM MARKET FORECAST 2024-2032
MARKET OVERVIEW
The global energy retrofit system market is expected to reach $xx million by 2032, growing at a CAGR of 6.65% during the forecast period. The base year considered for the study is 2023, and the forecast period is between 2024 and 2032.
Energy retrofit systems entail services dedicated to enhancing the energy efficiency of existing buildings worldwide. Through the installation of upgraded insulation, windows, lighting, heating/cooling equipment, and other improvements, the system attempts to decrease energy consumption and costs in outdated structures.
With an international presence, it prioritizes cost-effective solutions, utilizing technology that proves economically viable over time through utility savings. This approach reduces fossil fuel usage and lowers carbon emissions, contributing to climate benefits. While new green constructions may capture commercial appeal, retrofitting existing buildings represents a substantial opportunity for efficiency, utilizing already economical technologies.
Read our latest blog on the Energy Retrofit System Market
GROWTH ENABLERS
Key growth enablers of the global energy retrofit system market:- Advancements in retrofit technologies improving efficiency and lowering costs
- Government policies and incentives promoting energy efficiency in buildings
- Government regulations, codes, standards and financial incentives aimed at improving building energy efficiency have emerged as an important driver powering the adoption of energy retrofits globally.
- By requiring specific performance standards in renovations or new constructions, policies accelerate the demand for enhancements such as improved insulation, high-efficiency HVAC systems, and integrated renewable power.
- Further, these policies also address the split incentive barriers between owners and occupants. Additionally, subsidies, rebates, and favorable financing options enhance the attractiveness of projects by improving payback horizons.
- Rising energy costs driving demand for retrofits to reduce costs
- Increased awareness of environmental impacts driving adoption of green solutions
GROWTH RESTRAINTS
Key growth restraining factors of the global energy retrofit system market:
- High upfront costs and long payback periods
- Lack of skilled personnel to implement advanced retrofit solutions
- While technology continues advancing to enable more optimized and integrated energy retrofit solutions for buildings, a shortage of personnel with the required skillsets to effectively implement these upgrades has surfaced as a restraint slowing further adoption.
- Further, the integration of renewable systems, HVAC optimizations, envelope improvements, onsite generation and smart energy management requires expertise across numerous domains along with an ability to assess buildings holistically and simulate complex interactions.
- However, companies still report persistent competency gaps in recruiting engineers, designers, project developers, and specialized technicians for retrofit execution. Building owners planning significant deep energy renovations consequently encounter difficulties in finding providers with a demonstrated proficiency in managing multifaceted projects. Training programs backed by governments and industry groups have shown some success in improving expertise but require consistent attention to maintain their effectiveness.
- Disruptions caused by retrofit activities to building operations
To Know More About This Report, Request a Free Sample Copy
KEY MARKET TRENDS
Global Energy Retrofit System Market | Top Market Trends- Energy service companies (ESCOs) have emerged as an innovative business model to help overcome cost barriers to energy efficiency retrofits. ESCOs provide the upfront capital for projects and are then compensated through a share of the energy savings over time. This minimizes the need for large initial investments by building owners. These companies have seen increased adoption in recent years as a way to finance retrofit projects that otherwise may not have moved forward.
- Additionally, there has been a trend toward deeper, more comprehensive retrofits across the global energy efficiency market rather than minor upgrades. Though more complex at the outset, deep retrofits can achieve significantly higher and longer-lasting efficiency gains. With advancements in technology and increasing project expertise, deep retrofits are now considered a more favorable long-term investment compared to undertaking repeated small projects over time. However, this often necessitates greater capital availability, a challenge that business models such as ESCOs can assist in overcoming.
MARKET SEGMENTATION
Market Segmentation – By Product, By Application, and By Type
Market by Product:
- Envelope
- Envelope is anticipated to be the fastest-growing product in the global energy retrofit system market between 2024 and 2032.
- The building envelope sub-segment in the global energy retrofit system market has witnessed continuous expansion. This growth is attributed to ongoing improvements in roofs, walls, windows, and doors, all targeted at enhancing insulation. These enhancements play a crucial role in significantly reducing overall heat loss and energy consumption in buildings.
- Further, as technology progresses for high-performance insulation materials and costs gradually decrease, the adoption rates of envelope retrofits have seen a moderate increase compared to previous decades. The implementation of building codes and efficiency standards by various countries has additionally prompted many owners and facilities managers to assess and carry out envelope upgrades during renovation projects.
- Though more complex and capital-intensive upfront, envelope retrofits yield valuable energy savings over the lifespan of buildings. In addition, improved construction techniques and expanding installer bases with specialized retrofitting expertise have helped improve the execution and performance of envelope upgrades over time. Advanced modeling tools and innovative materials have enhanced the precision in targeting heat flows and losses. Envelope solutions are anticipated to persist in their growth as a fundamental component in advancing global energy efficiency objectives and meeting targets for reducing greenhouse gas emissions.
- LED Lighting
- Appliances
- HVAC
Market by Application:
- Residential
- In 2023, the residential segment dominated the application category.
- The residential sub-segment holds a substantial share in the global building domain and energy consumption. Consequently, it is essential to focus on the energy retrofit market. Introducing enhancements such as weatherization, upgrading heating and cooling systems, improving lighting, and implementing smart controls in residential spaces can result in significant efficiency gains and ongoing cost savings.
- Additionally, government incentives and the growing consumer interest in reducing energy bills have stimulated activity in this sector. However, challenges persist due to homeowners’ apprehensions about upfront costs and the time required for payback.
- Gradual technology improvements like less expensive solar panels, advancements in heat pumps and LED lighting combined with rising electricity prices in many areas help make projects more appealing. Moreover, the growing recognition of smart home technologies and connectivity, along with the introduction of time-of-use electricity pricing models, has broadened the global acceptance of residential energy retrofits. Increasing apprehensions about greenhouse gas emissions are also encouraging more households to deliberate sustainable upgrades to their living spaces, particularly when economically feasible in the long run.
- Institutional
- Commercial
Market by Type:
- Deep Retrofit
- Quick Wins Retrofit
GEOGRAPHICAL STUDY
Geographical Study based on Four Major Regions:
- North America: The United States and Canada
- Europe: The United Kingdom, Germany, France, Italy, Spain, Belgium, Poland, and Rest of Europe
- Asia-Pacific: China, Japan, India, South Korea, Indonesia, Thailand, Vietnam, Australia & New Zealand, and Rest of Asia-Pacific
- The Asia-Pacific has witnessed consistent growth in the global energy retrofit systems market in recent years. Developing economic growth and rapid urbanization in China, India, and Southeast Asia have resulted in a substantial increase in electricity consumption and peak energy demand.
- The heightened focus on ambitious sustainability targets in numerous APAC countries has shown a heightened focus accompanied by a growing acknowledgment of the potential for long-term cost savings. This has generated significant interest and initiatives aimed at enhancing the energy efficiency of buildings throughout the region. The implementation of government policies and incentive programs has further expedited the adoption of retrofitting measures.
- The warmer climates of many parts of APAC, along with large and growing middle classes, have increased demand for residential cooling solutions and subsequent efficiency opportunities through retrofits. Though the disconnected nature of buildings and construction sectors, as well as capital costs, set challenges, the market fundamentals suggest a continued gradual growth course for energy retrofits across APAC. Governments and consumers alike look to reduce energy expenditures and address carbon emissions through efficiency.
- Rest of World: Latin America, the Middle East & Africa
MAJOR PLAYERS
Major players in the global energy retrofit system market:
- Johnson Controls
- AECOM
- Daikin Industries
- Trane
- Ameresco
Key strategies adopted by some of these companies:
- Johnson Controls, in May 2022, introduced the OpenBlue Enterprise Manager, a software platform that offers an optimized, unified interface for energy and building management across entire asset portfolios. This product aims to enhance efficiency and reduce operating costs for customers.
- AECOM, in December 2021, acquired the OBAS Group, a regional engineering, architecture and consulting firm, to expand its services in Florida, including energy assessments, resilient design and building commissioning. The deal further strengthens AECOM’s expertise in energy efficiency solutions.
- Daikin, in June 2021, introduced its premium series of high-performance compact air source heat pumps with integrated energy recovery technology. Its efficient integration aims to maximize energy savings, comfort, and resiliency in retrofit projects.
REPORT SYNOPSIS
| REPORT SCOPE | DETAILS |
|---|---|
| Market Forecast Years | 2024-2032 |
| Base Year | 2023 |
| Market Historical Years | 2018-2022 |
| Forecast Units | Revenue ($ Million) |
| Segments Analyzed | Product, Application, and Type |
| Geographies Analyzed | North America, Europe, Asia-Pacific, and Rest of World |
| Companies Analyzed | Johnson Controls, AECOM, Daikin Industries, Trane, Ameresco, Eaton, Orion Energy Systems, Schneider Electric, General Electric, Philips Lighting, ENGIE, Siemens, The Brewer-Garrett Company, Digi-Key Electronics, Renesas Electronics Corporation |
RESEARCH SCOPE & METHODOLOGY
- STUDY OBJECTIVES
- METHODOLOGY
- ASSUMPTIONS & LIMITATIONS
EXECUTIVE SUMMARY
- MARKET SIZE & ESTIMATES
- MARKET OVERVIEW
- SCOPE OF STUDY
- MAJOR MARKET FINDINGS
- INCREASING DEMAND FOR ENERGY-EFFICIENT BUILDINGS AND GREEN BUILDING CERTIFICATIONS
- EMERGENCE OF PERFORMANCE CONTRACTING MODELS
- INNOVATIVE FINANCING MODELS AND FUNDING SOURCES
MARKET DYNAMICS
- KEY DRIVERS
- ADVANCEMENTS IN RETROFIT TECHNOLOGIES IMPROVING EFFICIENCY AND LOWERING COSTS
- INCREASED AWARENESS OF ENVIRONMENTAL IMPACTS DRIVING ADOPTION OF GREEN SOLUTIONS
- GOVERNMENT POLICIES AND INCENTIVES PROMOTING ENERGY EFFICIENCY IN BUILDINGS
- RISING ENERGY COSTS DRIVING DEMAND FOR RETROFITS TO REDUCE COST
- KEY RESTRAINTS
- DISRUPTIONS CAUSED BY RETROFIT ACTIVITIES TO BUILDING OPERATIONS
- HIGH UPFRONT COSTS AND LONG PAYBACK PERIODS
- LACK OF SKILLED PERSONNEL TO IMPLEMENT ADVANCED RETROFIT SOLUTIONS
- KEY DRIVERS
KEY ANALYTICS
- KEY MARKET TRENDS
- INCREASED ADOPTION OF DEEP RETROFITS ACHIEVES HIGHER EFFICIENCY GAINS
- LEVERAGING IOT AND DATA ANALYTICS OPTIMIZES EFFICIENCY OF RETROFITS
- INNOVATIVE BUSINESS MODELS LIKE ESCOS OVERCOME COST BARRIERS
- CONVERGENCE OF RETROFITS WITH RENEWABLE ENERGY, STORAGE, AND EVS PROVIDES GRID SERVICES
- PORTER’S FIVE FORCES ANALYSIS
- BUYERS POWER
- SUPPLIERS POWER
- SUBSTITUTION
- NEW ENTRANTS
- INDUSTRY RIVALRY
- GROWTH PROSPECT MAPPING
- GROWTH PROSPECT MAPPING FOR UNITED STATES
- GROWTH PROSPECT MAPPING FOR GERMANY
- GROWTH PROSPECT MAPPING FOR CHINA
- GROWTH PROSPECT MAPPING FOR UNITED ARAB EMIRATES
- MARKET MATURITY ANALYSIS
- MARKET CONCENTRATION ANALYSIS
- VALUE CHAIN ANALYSIS
- DISTRIBUTION CHANNELS
- ENERGY CONSUMERS AND END USERS
- ENERGY EFFICIENCY TECHNOLOGY PROVIDERS
- RETROFIT SOLUTION MANUFACTURERS
- KEY BUYING CRITERIA
- ENERGY EFFICIENCY AND PERFORMANCE
- SYSTEM RELIABILITY AND LONGEVITY
- SUPPORT SERVICES AND USER TRAINING
- TECHNOLOGICAL INNOVATIONS IN RETROFIT SYSTEMS
- KEY MARKET TRENDS
MARKET BY TYPE
- DEEP RETROFIT
- MARKET FORECAST FIGURE
- SEGMENT ANALYSIS
- QUICK WINS RETROFIT
- MARKET FORECAST FIGURE
- SEGMENT ANALYSIS
- DEEP RETROFIT
MARKET BY PRODUCT
- ENVELOPE
- MARKET FORECAST FIGURE
- SEGMENT ANALYSIS
- LED LIGHTING
- MARKET FORECAST FIGURE
- SEGMENT ANALYSIS
- APPLIANCES
- MARKET FORECAST FIGURE
- SEGMENT ANALYSIS
- HVAC
- MARKET FORECAST FIGURE
- SEGMENT ANALYSIS
- ENVELOPE
MARKET BY APPLICATION
- RESIDENTIAL
- MARKET FORECAST FIGURE
- SEGMENT ANALYSIS
- INSTITUTIONAL
- MARKET FORECAST FIGURE
- SEGMENT ANALYSIS
- COMMERCIAL
- MARKET FORECAST FIGURE
- SEGMENT ANALYSIS
- RESIDENTIAL
GEOGRAPHICAL ANALYSIS
- NORTH AMERICA
- MARKET SIZE & ESTIMATES
- NORTH AMERICA ENERGY RETROFIT SYSTEM MARKET DRIVERS
- NORTH AMERICA ENERGY RETROFIT SYSTEM MARKET CHALLENGES
- NORTH AMERICA ENERGY RETROFIT SYSTEM MARKET REGULATORY FRAMEWORK
- KEY PLAYERS IN NORTH AMERICA ENERGY RETROFIT SYSTEM MARKET
- COUNTRY ANALYSIS
- UNITED STATES
- UNITED STATES ENERGY RETROFIT SYSTEM MARKET SIZE & OPPORTUNITIES
- CANADA
- CANADA ENERGY RETROFIT SYSTEM MARKET SIZE & OPPORTUNITIES
- UNITED STATES
- EUROPE
- MARKET SIZE & ESTIMATES
- EUROPE ENERGY RETROFIT SYSTEM MARKET DRIVERS
- EUROPE ENERGY RETROFIT SYSTEM MARKET CHALLENGES
- EUROPE ENERGY RETROFIT SYSTEM MARKET REGULATORY FRAMEWORK
- KEY PLAYERS IN EUROPE ENERGY RETROFIT SYSTEM MARKET
- COUNTRY ANALYSIS
- UNITED KINGDOM
- UNITED KINGDOM ENERGY RETROFIT SYSTEM MARKET SIZE & OPPORTUNITIES
- GERMANY
- GERMANY ENERGY RETROFIT SYSTEM MARKET SIZE & OPPORTUNITIES
- FRANCE
- FRANCE ENERGY RETROFIT SYSTEM MARKET SIZE & OPPORTUNITIES
- ITALY
- ITALY ENERGY RETROFIT SYSTEM MARKET SIZE & OPPORTUNITIES
- SPAIN
- SPAIN ENERGY RETROFIT SYSTEM MARKET SIZE & OPPORTUNITIES
- BELGIUM
- BELGIUM ENERGY RETROFIT SYSTEM MARKET SIZE & OPPORTUNITIES
- POLAND
- POLAND ENERGY RETROFIT SYSTEM MARKET SIZE & OPPORTUNITIES
- REST OF EUROPE
- REST OF EUROPE ENERGY RETROFIT SYSTEM MARKET SIZE & OPPORTUNITIES
- UNITED KINGDOM
- ASIA-PACIFIC
- MARKET SIZE & ESTIMATES
- ASIA-PACIFIC ENERGY RETROFIT SYSTEM MARKET DRIVERS
- ASIA-PACIFIC ENERGY RETROFIT SYSTEM MARKET CHALLENGES
- ASIA-PACIFIC ENERGY RETROFIT SYSTEM MARKET REGULATORY FRAMEWORK
- KEY PLAYERS IN ASIA-PACIFIC ENERGY RETROFIT SYSTEM MARKET
- COUNTRY ANALYSIS
- CHINA
- CHINA ENERGY RETROFIT SYSTEM MARKET SIZE & OPPORTUNITIES
- JAPAN
- JAPAN ENERGY RETROFIT SYSTEM MARKET SIZE & OPPORTUNITIES
- INDIA
- INDIA ENERGY RETROFIT SYSTEM MARKET SIZE & OPPORTUNITIES
- SOUTH KOREA
- SOUTH KOREA ENERGY RETROFIT SYSTEM MARKET SIZE & OPPORTUNITIES
- THAILAND
- THAILAND ENERGY RETROFIT SYSTEM MARKET SIZE & OPPORTUNITIES
- VIETNAM
- VIETNAM ENERGY RETROFIT SYSTEM MARKET SIZE & OPPORTUNITIES
- INDONESIA
- INDONESIA ENERGY RETROFIT SYSTEM MARKET SIZE & OPPORTUNITIES
- AUSTRALIA & NEW ZEALAND
- AUSTRALIA & NEW ZEALAND ENERGY RETROFIT SYSTEM MARKET SIZE & OPPORTUNITIES
- REST OF ASIA-PACIFIC
- REST OF ASIA-PACIFIC ENERGY RETROFIT SYSTEM MARKET SIZE & OPPORTUNITIES
- CHINA
- REST OF WORLD
- MARKET SIZE & ESTIMATES
- REST OF WORLD ENERGY RETROFIT SYSTEM MARKET DRIVERS
- REST OF WORLD ENERGY RETROFIT SYSTEM MARKET CHALLENGES
- REST OF WORLD ENERGY RETROFIT SYSTEM REGULATORY FRAMEWORK
- KEY PLAYERS IN REST OF WORLD ENERGY RETROFIT SYSTEM MARKET
- REGIONAL ANALYSIS
- LATIN AMERICA
- LATIN AMERICA ENERGY RETROFIT SYSTEM MARKET SIZE & OPPORTUNITIES
- MIDDLE EAST & AFRICA
- MIDDLE EAST & AFRICA ENERGY RETROFIT SYSTEM MARKET SIZE & OPPORTUNITIES
- LATIN AMERICA
- NORTH AMERICA
COMPETITIVE LANDSCAPE
- KEY STRATEGIC DEVELOPMENTS
- MERGERS & ACQUISITIONS
- PRODUCT LAUNCHES & DEVELOPMENTS
- PARTNERSHIPS & AGREEMENTS
- BUSINESS EXPANSIONS & DIVESTITURES
- COMPANY PROFILES
- JOHNSON CONTROLS
- COMPANY OVERVIEW
- PRODUCT LIST
- STRENGTHS & CHALLENGES
- AECOM
- COMPANY OVERVIEW
- PRODUCT LIST
- STRENGTHS & CHALLENGES
- DAIKIN INDUSTRIES
- COMPANY OVERVIEW
- PRODUCT LIST
- STRENGTHS & CHALLENGES
- TRANE
- COMPANY OVERVIEW
- PRODUCT LIST
- STRENGTHS & CHALLENGES
- AMERESCO
- COMPANY OVERVIEW
- PRODUCT LIST
- STRENGTHS & CHALLENGES
- EATON
- COMPANY OVERVIEW
- PRODUCT LIST
- STRENGTHS & CHALLENGES
- ORION ENERGY SYSTEMS
- COMPANY OVERVIEW
- PRODUCT LIST
- STRENGTHS & CHALLENGES
- SCHNEIDER ELECTRIC
- COMPANY OVERVIEW
- PRODUCTS LIST
- STRENGTHS & CHALLENGES
- GENERAL ELECTRIC
- COMPANY OVERVIEW
- PRODUCT LIST
- STRENGTHS & CHALLENGES
- PHILIPS LIGHTING
- COMPANY OVERVIEW
- PRODUCTS LIST
- STRENGTHS & CHALLENGES
- ENGIE
- COMPANY OVERVIEW
- PRODUCT LIST
- STRENGTHS & CHALLENGES
- SIEMENS
- COMPANY OVERVIEW
- PRODUCTS LIST
- STRENGTHS & CHALLENGES
- THE BREWER-GARRETT COMPANY
- COMPANY OVERVIEW
- PRODUCT LIST
- STRENGTHS & CHALLENGES
- DIGI-KEY ELECTRONICS
- COMPANY OVERVIEW
- PRODUCT LIST
- STRENGTHS & CHALLENGES
- RENESAS ELECTRONICS CORPORATION
- COMPANY OVERVIEW
- PRODUCT LIST
- STRENGTHS & CHALLENGES
- JOHNSON CONTROLS
- KEY STRATEGIC DEVELOPMENTS
LIST OF TABLES
TABLE 1: MARKET SNAPSHOT – ENERGY RETROFIT SYSTEM MARKET
TABLE 2: GLOBAL ENERGY RETROFIT SYSTEM MARKET, BY TYPE, HISTORICAL YEARS, 2018-2022 (IN $ MILLION)
TABLE 3: GLOBAL ENERGY RETROFIT SYSTEM MARKET, BY TYPE, FORECAST YEARS, 2024-2032 (IN $ MILLION)
TABLE 4: GLOBAL DEEP RETROFIT MARKET, BY REGION, HISTORICAL YEARS, 2018-2022 (IN $ MILLION)
TABLE 5: GLOBAL DEEP RETROFIT MARKET, BY REGION, FORECAST YEARS, 2024-2032 (IN $ MILLION)
TABLE 6: GLOBAL QUICK WINS RETROFIT MARKET, BY REGION, HISTORICAL YEARS, 2018-2022 (IN $ MILLION)
TABLE 7: GLOBAL QUICK WINS RETROFIT MARKET, BY REGION, FORECAST YEARS, 2024-2032 (IN $ MILLION)
TABLE 8: GLOBAL ENERGY RETROFIT SYSTEM MARKET, BY PRODUCT, HISTORICAL YEARS, 2018-2022 (IN $ MILLION)
TABLE 9: GLOBAL ENERGY RETROFIT SYSTEM MARKET, BY PRODUCT, FORECAST YEARS, 2024-2032 (IN $ MILLION)
TABLE 10: GLOBAL ENVELOPE MARKET, BY REGION, HISTORICAL YEARS, 2018-2022 (IN $ MILLION)
TABLE 11: GLOBAL ENVELOPE MARKET, BY REGION, FORECAST YEARS, 2024-2032 (IN $ MILLION)
TABLE 12: GLOBAL LED LIGHTING MARKET, BY REGION, HISTORICAL YEARS, 2018-2022 (IN $ MILLION)
TABLE 13: GLOBAL LED LIGHTING MARKET, BY REGION, FORECAST YEARS, 2024-2032 (IN $ MILLION)
TABLE 14: GLOBAL APPLIANCES MARKET, BY REGION, HISTORICAL YEARS, 2018-2022 (IN $ MILLION)
TABLE 15: GLOBAL APPLIANCES MARKET, BY REGION, FORECAST YEARS, 2024-2032 (IN $ MILLION)
TABLE 16: GLOBAL HVAC MARKET, BY REGION, HISTORICAL YEARS, 2018-2022 (IN $ MILLION)
TABLE 17: GLOBAL HVAC MARKET, BY REGION, FORECAST YEARS, 2024-2032 (IN $ MILLION)
TABLE 18: GLOBAL ENERGY RETROFIT SYSTEM MARKET, BY APPLICATION, HISTORICAL YEARS, 2018-2022 (IN $ MILLION)
TABLE 19: GLOBAL ENERGY RETROFIT SYSTEM MARKET, BY APPLICATION, FORECAST YEARS, 2024-2032 (IN $ MILLION)
TABLE 20: GLOBAL RESIDENTIAL MARKET, BY REGION, HISTORICAL YEARS, 2018-2022 (IN $ MILLION)
TABLE 21: GLOBAL RESIDENTIAL MARKET, BY REGION, FORECAST YEARS, 2024-2032 (IN $ MILLION)
TABLE 22: GLOBAL INSTITUTIONAL MARKET, BY REGION, HISTORICAL YEARS, 2018-2022 (IN $ MILLION)
TABLE 23: GLOBAL INSTITUTIONAL MARKET, BY REGION, FORECAST YEARS, 2024-2032 (IN $ MILLION)
TABLE 24: GLOBAL COMMERCIAL MARKET, BY REGION, HISTORICAL YEARS, 2018-2022 (IN $ MILLION)
TABLE 25: GLOBAL COMMERCIAL MARKET, BY REGION, FORECAST YEARS, 2024-2032 (IN $ MILLION)
TABLE 26: GLOBAL ENERGY RETROFIT SYSTEM MARKET, BY GEOGRAPHY, HISTORICAL YEARS, 2018-2022 (IN $ MILLION)
TABLE 27: GLOBAL ENERGY RETROFIT SYSTEM MARKET, BY GEOGRAPHY, FORECAST YEARS, 2024-2032 (IN $ MILLION)
TABLE 28: NORTH AMERICA ENERGY RETROFIT SYSTEM MARKET, BY COUNTRY, HISTORICAL YEARS, 2018-2022 (IN $ MILLION)
TABLE 29: NORTH AMERICA ENERGY RETROFIT SYSTEM MARKET, BY COUNTRY, FORECAST YEARS, 2024-2032 (IN $ MILLION)
TABLE 30: NORTH AMERICA ENERGY RETROFIT SYSTEM MARKET REGULATORY FRAMEWORK
TABLE 31: KEY PLAYERS OPERATING IN NORTH AMERICA ENERGY RETROFIT SYSTEM MARKET
TABLE 32: EUROPE ENERGY RETROFIT SYSTEM MARKET, BY COUNTRY, HISTORICAL YEARS, 2018-2022 (IN $ MILLION)
TABLE 33: EUROPE ENERGY RETROFIT SYSTEM MARKET, BY COUNTRY, FORECAST YEARS, 2024-2032 (IN $ MILLION)
TABLE 34: EUROPE ENERGY RETROFIT SYSTEM MARKET REGULATORY FRAMEWORK
TABLE 35: KEY PLAYERS OPERATING IN EUROPE ENERGY RETROFIT SYSTEM MARKET
TABLE 36: ASIA-PACIFIC ENERGY RETROFIT SYSTEM MARKET, BY COUNTRY, HISTORICAL YEARS, 2018-2022 (IN $ MILLION)
TABLE 37: ASIA-PACIFIC ENERGY RETROFIT SYSTEM MARKET, BY COUNTRY, FORECAST YEARS, 2024-2032 (IN $ MILLION)
TABLE 38: ASIA-PACIFIC ENERGY RETROFIT SYSTEM MARKET REGULATORY FRAMEWORK
TABLE 39: KEY PLAYERS OPERATING IN ASIA-PACIFIC ENERGY RETROFIT SYSTEM MARKET
TABLE 40: REST OF WORLD ENERGY RETROFIT SYSTEM MARKET, BY REGION, HISTORICAL YEARS, 2018-2022 (IN $ MILLION)
TABLE 41: REST OF WORLD ENERGY RETROFIT SYSTEM MARKET, BY REGION, FORECAST YEARS, 2024-2032 (IN $ MILLION)
TABLE 42: REST OF WORLD ENERGY RETROFIT SYSTEM MARKET REGULATORY FRAMEWORK
TABLE 43: KEY PLAYERS OPERATING IN REST OF WORLD ENERGY RETROFIT SYSTEM MARKET
TABLE 44: LIST OF MERGERS & ACQUISITIONS
TABLE 45: LIST OF PRODUCT LAUNCHES & DEVELOPMENTS
TABLE 46: LIST OF PARTNERSHIPS & AGREEMENTS
TABLE 47: LIST OF BUSINESS EXPANSIONS & DIVESTITURES
LIST OF FIGURES
FIGURE 1: KEY MARKET TRENDS
FIGURE 2: PORTER’S FIVE FORCES ANALYSIS
FIGURE 3: GROWTH PROSPECT MAPPING FOR UNITED STATES
FIGURE 4: GROWTH PROSPECT MAPPING FOR GERMANY
FIGURE 5: GROWTH PROSPECT MAPPING FOR CHINA
FIGURE 6: GROWTH PROSPECT MAPPING FOR UNITED ARAB EMIRATES
FIGURE 7: MARKET MATURITY ANALYSIS
FIGURE 8: MARKET CONCENTRATION ANALYSIS
FIGURE 9: GLOBAL ENERGY RETROFIT SYSTEM MARKET, GROWTH POTENTIAL, BY TYPE, IN 2023
FIGURE 10: GLOBAL ENERGY RETROFIT SYSTEM MARKET, BY DEEP RETROFIT, 2024-2032 (IN $ MILLION)
FIGURE 11: GLOBAL ENERGY RETROFIT SYSTEM MARKET, BY QUICK WINS RETROFIT, 2024-2032 (IN $ MILLION)
FIGURE 12: GLOBAL ENERGY RETROFIT SYSTEM MARKET, GROWTH POTENTIAL, BY PRODUCT, IN 2023
FIGURE 13: GLOBAL ENERGY RETROFIT SYSTEM MARKET, BY ENVELOPE, 2024-2032 (IN $ MILLION)
FIGURE 14: GLOBAL ENERGY RETROFIT SYSTEM MARKET, BY LED LIGHTING, 2024-2032 (IN $ MILLION)
FIGURE 15: GLOBAL ENERGY RETROFIT SYSTEM MARKET, BY APPLIANCES, 2024-2032 (IN $ MILLION)
FIGURE 16: GLOBAL ENERGY RETROFIT SYSTEM MARKET, BY HVAC, 2024-2032 (IN $ MILLION)
FIGURE 17: GLOBAL ENERGY RETROFIT SYSTEM MARKET, GROWTH POTENTIAL, BY APPLICATION, IN 2023
FIGURE 18: GLOBAL ENERGY RETROFIT SYSTEM MARKET, BY RESIDENTIAL, 2024-2032 (IN $ MILLION)
FIGURE 19: GLOBAL ENERGY RETROFIT SYSTEM MARKET, BY INSTITUTIONAL, 2024-2032 (IN $ MILLION)
FIGURE 20: GLOBAL ENERGY RETROFIT SYSTEM MARKET, BY COMMERCIAL, 2024-2032 (IN $ MILLION)
FIGURE 21: NORTH AMERICA ENERGY RETROFIT SYSTEM MARKET, COUNTRY OUTLOOK, 2023 & 2032 (IN %)
FIGURE 22: UNITED STATES ENERGY RETROFIT SYSTEM MARKET, 2024-2032 (IN $ MILLION)
FIGURE 23: CANADA ENERGY RETROFIT SYSTEM MARKET, 2024-2032 (IN $ MILLION)
FIGURE 24: EUROPE ENERGY RETROFIT SYSTEM MARKET, COUNTRY OUTLOOK, 2023 & 2032 (IN %)
FIGURE 25: UNITED KINGDOM ENERGY RETROFIT SYSTEM MARKET, 2024-2032 (IN $ MILLION)
FIGURE 26: GERMANY ENERGY RETROFIT SYSTEM MARKET, 2024-2032 (IN $ MILLION)
FIGURE 27: FRANCE ENERGY RETROFIT SYSTEM MARKET, 2024-2032 (IN $ MILLION)
FIGURE 28: ITALY ENERGY RETROFIT SYSTEM MARKET, 2024-2032 (IN $ MILLION)
FIGURE 29: SPAIN ENERGY RETROFIT SYSTEM MARKET, 2024-2032 (IN $ MILLION)
FIGURE 30: BELGIUM ENERGY RETROFIT SYSTEM MARKET, 2024-2032 (IN $ MILLION
FIGURE 31: POLAND ENERGY RETROFIT SYSTEM MARKET, 2024-2032 (IN $ MILLION)
FIGURE 32: REST OF EUROPE ENERGY RETROFIT SYSTEM MARKET, 2024-2032 (IN $ MILLION)
FIGURE 33: ASIA-PACIFIC ENERGY RETROFIT SYSTEM MARKET, COUNTRY OUTLOOK, 2023 & 2032 (IN %)
FIGURE 34: CHINA ENERGY RETROFIT SYSTEM MARKET, 2024-2032 (IN $ MILLION)
FIGURE 35: JAPAN ENERGY RETROFIT SYSTEM MARKET, 2024-2032 (IN $ MILLION)
FIGURE 36: INDIA ENERGY RETROFIT SYSTEM MARKET, 2024-2032 (IN $ MILLION)
FIGURE 37: SOUTH KOREA ENERGY RETROFIT SYSTEM MARKET, 2024-2032 (IN $ MILLION)
FIGURE 38: THAILAND ENERGY RETROFIT SYSTEM MARKET, 2024-2032 (IN $ MILLION)
FIGURE 39: VIETNAM ENERGY RETROFIT SYSTEM MARKET, 2024-2032 (IN $ MILLION)
FIGURE 40: INDONESIA ENERGY RETROFIT SYSTEM MARKET, 2024-2032 (IN $ MILLION)
FIGURE 41: AUSTRALIA & NEW ZEALAND ENERGY RETROFIT SYSTEM MARKET, 2024-2032 (IN $ MILLION)
FIGURE 42: REST OF ASIA-PACIFIC ENERGY RETROFIT SYSTEM MARKET, 2024-2032 (IN $ MILLION)
FIGURE 43: REST OF WORLD ENERGY RETROFIT SYSTEM MARKET, REGIONAL OUTLOOK, 2023 & 2032 (IN %)
FIGURE 44: LATIN AMERICA ENERGY RETROFIT SYSTEM MARKET, 2024-2032 (IN $ MILLION)
FIGURE 45: MIDDLE EAST & AFRICA ENERGY RETROFIT SYSTEM MARKET, 2024-2032 (IN $ MILLION)
FAQ’s
FAQs
The global energy retrofit system market is essential in combating climate change and achieving sustainability objectives. By reducing energy consumption, mitigating greenhouse gas emissions, and enhancing resource efficiency, the market actively contributes to the creation of a more sustainable and resilient built environment.
Energy retrofit systems find relevance across diverse building types, encompassing residential, commercial, and industrial structures. Whether applied to homes, office buildings, or manufacturing facilities, these systems can be customized to different areas, optimizing overall energy performance.
The global implementation of energy retrofit systems can lead to substantial cost savings in the long run. Enhancing energy efficiency on a worldwide scale allows businesses and homeowners to decrease both utility bills and operational expenses. The initial investment in global retrofitting is frequently surpassed by enduring financial advantages.
RELATED REPORTS
-
GLOBAL VIRTUAL PIPELINE SYSTEMS MARKET FORECAST 2024-2032
-
GLOBAL VIRTUAL POWER PLANT MARKET FORECAST 2024-2032
-
ASIA-PACIFIC VIRTUAL POWER PLANT MARKET FORECAST 2024-2032
-
EUROPE VIRTUAL POWER PLANT MARKET FORECAST 2024-2032
-
NORTH AMERICA VIRTUAL POWER PLANT MARKET FORECAST 2024-2032
-
SOUTH KOREA VIRTUAL POWER PLANT MARKET FORECAST 2024-2032
-
FRANCE VIRTUAL POWER PLANT MARKET FORECAST 2024-2032
-
UNITED STATES VIRTUAL POWER PLANT MARKET FORECAST 2024-2032
-
UNITED STATES ENERGY RETROFIT SYSTEM MARKET FORECAST 2024-2032
-
CHINA ENERGY RETROFIT SYSTEM MARKET FORECAST 2024-2032