GLOBAL BLUE AMMONIA MARKET FORECAST 2024-2050
SCOPE OF THE REPORT
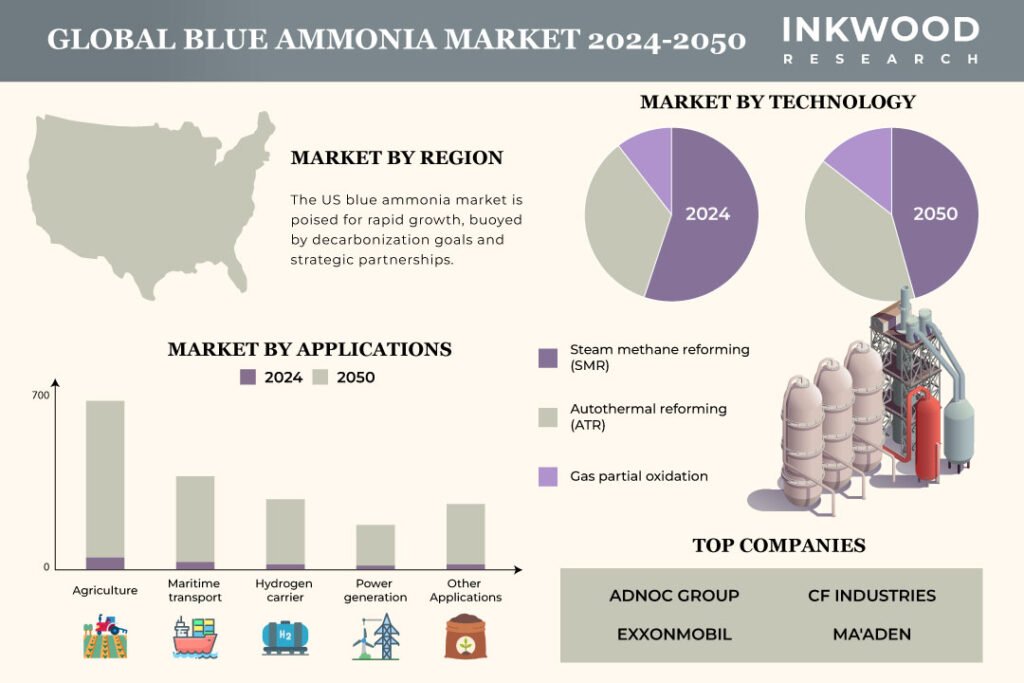
Global Blue Ammonia Market by Technology (Steam Methane Reforming, Autothermal Reforming, Gas Partial Oxidation) Market by Application (Agriculture, Maritime Transport, Hydrogen Carrier, Power Generation, Other Applications) by Geography
REPORTS » ENVIRONMENT » ENVIRONMENT SERVICES » GLOBAL BLUE AMMONIA MARKET FORECAST 2024-2050
MARKET OVERVIEW
The global blue ammonia market is valued at $113.96 million in 2024 and is expected to reach $74413.57 million by 2050, growing at a CAGR of 52.22% during 2025-2030, 38.25% during 2030-2035, 25.20% during 2035-2040, 16.68% during 2040-2045, and 7.89% during 2045-2050. The base year considered for the study is 2023, and the estimated period is between 2024 and 2050.
Blue ammonia is poised to emerge as an eco-friendly substitute for grey ammonia. It is ammonia derived from natural gas with concurrent carbon capture and storage, ensuring over 90% of emitted carbon during production is captured and sequestered.
Further, blue ammonia holds the potential to decarbonize the fertilizer industry, aligning with the Paris Agreement goal for the industry by 2050. Additionally, blue ammonia is anticipated to transform the maritime, power, and energy domains, serving as a zero-carbon fuel for shipping and contributing significantly to low-carbon power generation and hydrogen transport.
Accordingly, blue ammonia is emerging as a pivotal market for transitioning toward decarbonizing chemicals, fertilizer, oil & gas, and other challenging-to-abate fossil-based industries.
Read our latest blog on the Blue Ammonia Market
GROWTH ENABLERS
Key enablers of the global blue ammonia market growth are:
- Surging efforts for carbon emission reduction
- Innovative infrastructure and sustainable scaling of blue ammonia production
- Advancing the hydrogen economy for sustainable energy solutions
- The adoption of hydrogen gas as a primary energy source in power generation, transportation, and industrial activities marks a transition toward a hydrogen economy. This shift is driven by the aim to diminish greenhouse gas emissions and reduce reliance on fossil fuels in response to climate change issues.
- Blue ammonia emerges as a compelling fuel in this transition, gaining recognition as a potential clean energy carrier and fuel source due to its minimal carbon emissions and versatile applications.
GROWTH RESTRAINTS
Key growth restraining factors of the global blue ammonia market are:
- Cost challenges in blue ammonia commercialization
- Limited public awareness and proprietary constraints
- Blue ammonia was a novel concept for chemical manufacturers before 2021. The technology is gradually gaining attention with increased research activities post-2021. However, it is expected to take some time before it becomes widely recognized and extensively documented in public sources.
- During the research & development stage, integrating blue ammonia into a Carbon Capture Storage (CCS) process presents intricate engineering and technological challenges.
- Also, proprietary rights held by companies and organizations engaged in blue ammonia R&D contribute to limited public disclosures, resulting in a lack of widespread implementation and public reporting of commercial-scale projects.
- Challenges in ammonia classification and standard adoption
To Know More About This Report, Request a Free Sample Copy
KEY MARKET TRENDS
Global Blue Ammonia Market | Top Trends
- Blue ammonia has emerged as an immediate solution, aiding the industry in reducing carbon intensity. Major players are exploring its potential in decarbonizing transport and maritime and as a carrier for hydrogen. In addition, blue ammonia serves as a decarbonization solution for heavy industries like steel and cement.
- Government incentives like tax credits, subsidies, and regulatory frameworks encouraging Carbon Capture Storage (CCS) and adoption of clean fuels are vital for market acceleration. Moreover, the implementation of carbon pricing schemes and cross-border carbon trade policies can incentivize the use of blue ammonia over grey alternatives.
MARKET SEGMENTATION
Market Segmentation Analysis – Technology and Application –
Market by Technology:
- Steam Methane Reforming (SMR)
- Steam methane reforming (SMR) is the dominating technology in the blue ammonia market.
- Ammonia production through the steam methane reforming (SMR) method is easy & inexpensive and represents 50%-70% of an ammonia plant’s CO2 emissions.
- Steam methane reforming (SMR) is the dominant industrial process for producing hydrogen, a crucial component in blue ammonia synthesis. This method involves blending natural gas (primarily methane, CH4) with steam (H2O) over a nickel catalyst at high temperatures (around 800°C) to generate a mixture of hydrogen (H2) and carbon monoxide (CO).
- Autothermal Reforming (ATR)
- Gas Partial Oxidation
Market by Application:
- Agriculture
- Agriculture is the largest revenue-generating application in the blue ammonia market.
- Blue ammonia can be used as a fertilizer since it contains nitrogen, which is essential for plant growth. Ammonia is currently the most widely used nitrogen fertilizer in the world. However, it is mainly produced from fossil fuels, which emit greenhouse gases.
- The agriculture sector can reduce its carbon footprint by using blue ammonia, which has lower emissions than conventional ammonia.
- Maritime Transport
- Hydrogen Carrier
- Power Generation
- Other Applications
GEOGRAPHICAL STUDY
Country Analysis comprises Five Key Countries and others under Other Countries:
- The United States
- The United States is the dominating country in the blue ammonia market.
- The blue ammonia market is in its nascent stages in the United States. Nevertheless, it holds significant potential, fueled by climate goals and ammonia’s versatility as a clean fuel and fertilizer.
- Moreover, the US government is launching initiatives like the Infrastructure Investment and Jobs Act to support market growth, which allocated $8 billion for clean hydrogen hubs that indirectly support blue ammonia production.
- China
- Germany
- Japan
- South Korea
- Other Countries
MAJOR PLAYERS
The major players in the global blue ammonia market are:
- ADNOC Group
- CF Industries
- Ma’aden
- OCI Global
- POSCO Holdings Inc
- Shell
- Yara International
Key strategies adopted by some of these companies:
- In December 2023, CF Industries closed its acquisition of Incitec Pivot Limited’s ammonia production complex located in Waggaman, Louisiana. Under the terms of the agreement, CF Industries purchased the Waggaman ammonia plant and related assets for $1.675 billion, subject to adjustments.
- In November 2022, Saudi Arabian Mining Co (Maaden) signed a 20-year agreement with Gulf Cryo to build and operate a CO2 plant in its phosphate complex in Ras Al Khair. The new plant will capture 300,000 metric tons of CO2 emissions per year from Maaden’s three ammonia plants.
REPORT SYNOPSIS
| REPORT SCOPE | DETAILS |
|---|---|
| Market Forecast Years | 2024-2050 |
| Base Year | 2023 |
| Market Historical Years | 2020-2022 |
| Forecast Units | Revenue ($ Million) |
| Segments Analyzed | Technology and Application |
| Geographies Analyzed | The United States, China, Germany, Japan, South Korea, and Other Countries |
| Companies Analyzed | ADNOC Group, CF Industries, ExxonMobil, ITOCHU Corporation, Ma’aden, Nutrien Limited, OCI Global, POSCO Holdings Inc, Qatar Fertiliser Co (QAFCO), SABIC, Shell, SK Inc, Yara International |
TABLE OF CONTENT
RESEARCH SCOPE & METHODOLOGY
- STUDY OBJECTIVES
- METHODOLOGY
- ASSUMPTIONS & LIMITATIONS
EXECUTIVE SUMMARY
- MARKET SIZE & ESTIMATES
- MARKET OVERVIEW
- SCOPE OF STUDY
- MAJOR MARKET FINDINGS
- STEAM METHANE REFORMING (SMR) IS THE DOMINANT INDUSTRIAL PROCESS FOR PRODUCING HYDROGEN
- AGRICULTURE SECTOR IS ANTICIPATED TO ENCOMPASS MAJOR BLUE AMMONIA USAGE
- UNITED STATES IS AN EMERGING MARKET FUELED BY CLIMATE GOALS AND AMMONIA’S VERSATILITY AS A CLEAN FUEL AND FERTILIZER
MARKET DYNAMICS
- KEY DRIVERS
- SURGING EFFORTS FOR CARBON EMISSION REDUCTION
- INNOVATIVE INFRASTRUCTURE AND SUSTAINABLE SCALING OF BLUE AMMONIA PRODUCTION
- ADVANCING THE HYDROGEN ECONOMY FOR SUSTAINABLE ENERGY SOLUTIONS
- KEY RESTRAINTS
- COST CHALLENGES IN BLUE AMMONIA COMMERCIALIZATION
- LIMITED PUBLIC AWARENESS AND PROPRIETARY CONSTRAINTS
- CHALLENGES IN AMMONIA CLASSIFICATION AND STANDARD ADOPTION
- KEY DRIVERS
KEY ANALYTICS
- KEY MARKET TRENDS
- DECARBONIZING SOLUTIONS ACROSS AGRICULTURE AND OTHER INDUSTRIES
- ADVANCEMENTS IN TECHNOLOGY
- POLICY AND REGULATORY LANDSCAPE
- PORTER’S FIVE FORCES ANALYSIS
- BUYERS POWER
- SUPPLIERS POWER
- SUBSTITUTION
- NEW ENTRANTS
- INDUSTRY RIVALRY
- GROWTH PROSPECT MAPPING
- GROWTH PROSPECT MAPPING FOR UNITED STATES
- GROWTH PROSPECT MAPPING FOR GERMANY
- GROWTH PROSPECT MAPPING FOR CHINA
- MARKET MATURITY ANALYSIS
- MARKET CONCENTRATION ANALYSIS
- VALUE CHAIN ANALYSIS
- NATURAL GAS PRODUCTION
- AMMONIA PRODUCTION
- CARBON CAPTURE AND STORAGE (CCS)
- TRANSPORTATION AND STORAGE
- END-USE
- KEY BUYING CRITERIA
- COST
- CARBON FOOTPRINT
- INFRASTRUCTURE
- REGULATION
- SUPPLY CHAIN
- KEY MARKET TRENDS
MARKET BY TECHNOLOGY
- STEAM METHANE REFORMING (SMR)
- MARKET FORECAST FIGURE
- SEGMENT ANALYSIS
- AUTOTHERMAL REFORMING (ATR)
- MARKET FORECAST FIGURE
- SEGMENT ANALYSIS
- GAS PARTIAL OXIDATION
- MARKET FORECAST FIGURE
- SEGMENT ANALYSIS
- STEAM METHANE REFORMING (SMR)
MARKET BY APPLICATION
- AGRICULTURE
- MARKET FORECAST FIGURE
- SEGMENT ANALYSIS
- MARITIME TRANSPORT
- MARKET FORECAST FIGURE
- SEGMENT ANALYSIS
- HYDROGEN CARRIER
- MARKET FORECAST FIGURE
- SEGMENT ANALYSIS
- POWER GENERATION
- MARKET FORECAST FIGURE
- SEGMENT ANALYSIS
- OTHER APPLICATIONS
- MARKET FORECAST FIGURE
- SEGMENT ANALYSIS
- AGRICULTURE
COUNTRY ANALYSIS
- UNITED STATES
- MARKET FORECAST ESTIMATION
- SEGMENT ANALYSIS
- CHINA
- MARKET FORECAST ESTIMATION
- SEGMENT ANALYSIS
- GERMANY
- MARKET FORECAST ESTIMATION
- SEGMENT ANALYSIS
- JAPAN
- MARKET FORECAST ESTIMATION
- SEGMENT ANALYSIS
- SOUTH KOREA
- MARKET FORECAST ESTIMATION
- SEGMENT ANALYSIS
- OTHER COUNTRIES
- MARKET FORECAST ESTIMATION
- SEGMENT ANALYSIS
- UNITED STATES
COMPETITIVE LANDSCAPE
- KEY STRATEGIC DEVELOPMENTS
- ACQUISITIONS
- PRODUCT LAUNCHES & DEVELOPMENTS
- PARTNERSHIPS & AGREEMENTS
- BUSINESS EXPANSIONS & DIVESTITURES
- KEY STRATEGIC DEVELOPMENTS
COMPETITIVE LANDSCAPE
- KEY STRATEGIC DEVELOPMENTS
- MERGERS & ACQUISITIONS
- PRODUCT LAUNCHES & DEVELOPMENTS
- PARTNERSHIPS & AGREEMENTS
- BUSINESS EXPANSIONS & DIVESTITURES
- COMPANY PROFILES
- ADNOC GROUP
- COMPANY OVERVIEW
- STRENGTHS & CHALLENGES
- CF INDUSTRIES
- COMPANY OVERVIEW
- STRENGTHS & CHALLENGES
- EXXONMOBIL
- COMPANY OVERVIEW
- STRENGTHS & CHALLENGES
- ITOCHU CORPORATION
- COMPANY OVERVIEW
- STRENGTHS & CHALLENGES
- MA’ADEN
- COMPANY OVERVIEW
- STRENGTHS & CHALLENGES
- NUTRIEN LIMITED
- COMPANY OVERVIEW
- STRENGTHS & CHALLENGES
- OCI GLOBAL
- COMPANY OVERVIEW
- STRENGTHS & CHALLENGES
- POSCO HOLDINGS INC
- COMPANY OVERVIEW
- STRENGTHS & CHALLENGES
- QATAR FERTILIZER CO. (QAFCO)
- COMPANY OVERVIEW
- STRENGTHS & CHALLENGES
- SABIC
- COMPANY OVERVIEW
- STRENGTHS & CHALLENGES
- SHELL
- COMPANY OVERVIEW
- STRENGTHS & CHALLENGES
- SK INC
- COMPANY OVERVIEW
- STRENGTHS & CHALLENGES
- YARA INTERNATIONAL
- COMPANY OVERVIEW
- STRENGTHS & CHALLENGES
- ADNOC GROUP
- KEY STRATEGIC DEVELOPMENTS
LIST OF TABLES
TABLE 1: MARKET SNAPSHOT – BLUE AMMONIA
TABLE 2: GLOBAL BLUE AMMONIA MARKET, BY TECHNOLOGY, FORECAST YEARS, 2024-2050 (IN $ MILLION)
TABLE 3: GLOBAL BLUE AMMONIA MARKET, BY APPLICATION, FORECAST YEARS, 2024-2050 (IN $ MILLION)
TABLE 4: GLOBAL BLUE AMMONIA MARKET, BY COUNTRY, FORECAST YEARS, 2024-2050 (IN $ MILLION)
TABLE 5: LIST OF ACQUISITIONS
TABLE 6: LIST OF PRODUCT LAUNCHES & DEVELOPMENTS
TABLE 7: LIST OF PARTNERSHIPS & AGREEMENTS
TABLE 8: LIST OF BUSINESS EXPANSIONS & DIVESTITURES
TABLE 9: LIST OF MERGERS & ACQUISITIONS
TABLE 10: LIST OF PRODUCT LAUNCHES & DEVELOPMENTS
TABLE 11: LIST OF PARTNERSHIPS & AGREEMENTS
TABLE 12: LIST OF BUSINESS EXPANSIONS & DIVESTITURES
LIST OF FIGURES
FIGURE 1: PRODUCTION PROCESS OF BLUE AMMONIA
FIGURE 2: KEY MARKET TRENDS
FIGURE 3: PORTER’S FIVE FORCES ANALYSIS
FIGURE 4: GROWTH PROSPECT MAPPING FOR UNITED STATES
FIGURE 5: GROWTH PROSPECT MAPPING FOR GERMANY
FIGURE 6: GROWTH PROSPECT MAPPING FOR CHINA
FIGURE 7: MARKET MATURITY ANALYSIS
FIGURE 8: MARKET CONCENTRATION ANALYSIS
FIGURE 9: GLOBAL BLUE AMMONIA MARKET, GROWTH POTENTIAL, BY TECHNOLOGY, IN 2024
FIGURE 10: GLOBAL BLUE AMMONIA MARKET, BY STEAM METHANE REFORMING (SMR), 2024-2050 (IN $ MILLION)
FIGURE 11: GLOBAL BLUE AMMONIA MARKET, BY AUTOTHERMAL REFORMING (ATR), 2024-2050 (IN $ MILLION)
FIGURE 12: GLOBAL BLUE AMMONIA MARKET, BY GAS PARTIAL OXIDATION, 2024-2050 (IN $ MILLION)
FIGURE 13: GLOBAL BLUE AMMONIA MARKET, GROWTH POTENTIAL, BY APPLICATION, IN 2024
FIGURE 14: GLOBAL BLUE AMMONIA MARKET, BY AGRICULTURE, 2024-2050 (IN $ MILLION)
FIGURE 15: GLOBAL BLUE AMMONIA MARKET, BY MARITIME TRANSPORT, 2024-2050 (IN $ MILLION)
FIGURE 16: GLOBAL BLUE AMMONIA MARKET, BY HYDROGEN CARRIER, 2024-2050 (IN $ MILLION)
FIGURE 17: GLOBAL BLUE AMMONIA MARKET, BY POWER GENERATION, 2024-2050 (IN $ MILLION)
FIGURE 18: GLOBAL BLUE AMMONIA MARKET, BY OTHER APPLICATIONS, 2024-2050 (IN $ MILLION)
FIGURE 19: GLOBAL BLUE AMMONIA MARKET, GROWTH POTENTIAL, BY COUNTRY, IN 2024
FIGURE 20: UNITED STATES BLUE AMMONIA MARKET, 2024-2050 (IN $ MILLION)
FIGURE 21: CHINA BLUE AMMONIA MARKET, 2024-2050 (IN $ MILLION)
FIGURE 22: GERMANY BLUE AMMONIA MARKET, 2024-2050 (IN $ MILLION)
FIGURE 23: JAPAN BLUE AMMONIA MARKET, 2024-2050 (IN $ MILLION)
FIGURE 24: SOUTH KOREA BLUE AMMONIA MARKET, 2024-2050 (IN $ MILLION)
FIGURE 25: OTHER COUNTRIES BLUE AMMONIA MARKET, 2024-2050 (IN $ MILLION)
FAQ’s
FAQs
By 2050, the global blue ammonia market is expected to be valued at $74413.57 million.
South Korea is the fastest-growing country during the forecasted period in the global blue ammonia market.
Maritime transport and hydrogen carrier are among the fastest-growing applications in the global blue ammonia market.
RELATED REPORTS
-

GLOBAL REVERSE OSMOSIS COMPONENTS MARKET FORECAST 2025-2032
-

ASIA-PACIFIC REVERSE OSMOSIS COMPONENTS MARKET FORECAST 2025-2032
-

EUROPE REVERSE OSMOSIS COMPONENTS MARKET FORECAST 2025-2032
-

NORTH AMERICA REVERSE OSMOSIS COMPONENTS MARKET FORECAST 2025-2032
-

SINGAPORE REVERSE OSMOSIS COMPONENTS MARKET FORECAST 2025-2032
-
SOUTH AFRICA REVERSE OSMOSIS COMPONENTS MARKET FORECAST 2025-2032
-
SAUDI ARABIA REVERSE OSMOSIS COMPONENTS MARKET FORECAST 2025-2032
-
GLOBAL BIPV GLASS MARKET FORECAST 2024-2032
-

ASIA-PACIFIC BIPV GLASS MARKET FORECAST 2024-2032
-
EUROPE BIPV GLASS MARKET FORECAST 2024-2032