GLOBAL BIOREMEDIATION TECHNOLOGY AND SERVICES MARKET FORECAST 2024-2032
SCOPE OF THE REPORT
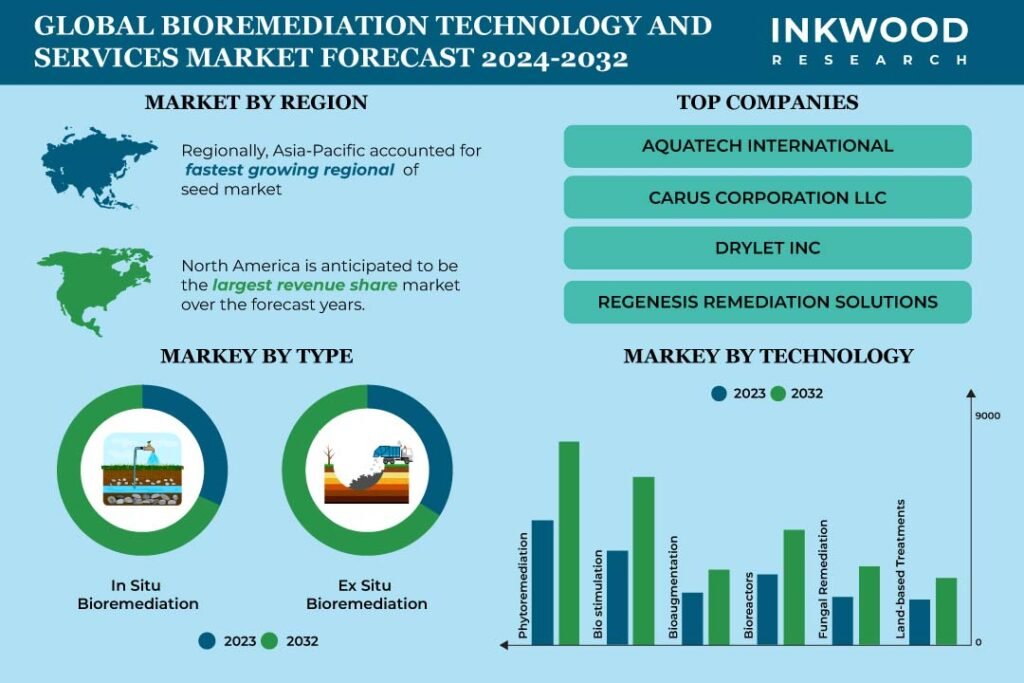
Global Bioremediation Technology and Services Market by Type (In-situ Bioremediation, Ex-situ Bioremediation) Market by Service (Soil Remediation, Wastewater Remediation, Oilfield Remediation, Other Services) Market by Technology (Phytoremediation, Biostimulation, Bioaugmentation, Bioreactors, Fungal Remediation, Land-based Treatments) by Geography
REPORTS » ENVIRONMENT » ENVIRONMENT TECHNOLOGIES » GLOBAL BIOREMEDIATION TECHNOLOGY AND SERVICES MARKET FORECAST 2024-2032
MARKET OVERVIEW
The global bioremediation technology and services market was valued at $xx million in 2023 and is expected to reach $xx million by 2032, growing at a CAGR of 7.82% during the forecast period, 2024-2032.
The market study has also analyzed the impact of COVID-19 on the bioremediation technology and services industry qualitatively as well as quantitatively.
Bioremediation technology is a sustainable and environmentally friendly approach employed to address pollution and contamination issues in the environment. It utilizes the natural capabilities of microorganisms, such as bacteria, fungi, and plants, to break down, metabolize, or transform pollutants into less harmful forms. This procedure helps in the cleanup of contaminated environments by enzymatically breaking down or incorporating pollutants.
Techniques used in bioremediation include phytoremediation, bioaugmentation, and biostimulation. This eco-friendly method has been successfully applied to address a wide range of environmental challenges, offering a sustainable alternative to conventional remediation approaches and contributing to the restoration and protection of ecosystems.
Read our latest blog on the Bioremediation Technology And Services Market
GROWTH ENABLERS
Key growth enablers of the global bioremediation technology and services market are:
- Increased industrialization and corresponding environmental deterioration
- Increasing government initiatives
- Stringent environmental regulations enforced globally by governments are compelling industries to address contaminated sites. For example, the European Union’s Water Framework Directive aims to maintain or improve the quality of water bodies, while China’s Soil Pollution Prevention and Control Law focuses on soil pollution prevention, public health protection, and sustainable development. These regulations drive the need for advanced and sustainable remediation technologies such as bioremediation, prompting increased investments in research and development by companies.
- Furthermore, government agencies such as the U.S. EPA (Environmental Protection Agency) support research and development in bioremediation technology by providing a range of grants and financial incentives. This encouragement fosters fundamental studies and the creation of fresh approaches to bioremediation.
- Widening applications in the commercial sector
GROWTH RESTRAINTS
Key growth restraining factors of the global bioremediation technology and services market are:
- Long duration of bioremediation processes
- Site-specific variability and uncertainty
- Environmental elements, such as temperature, pH, and nutrient availability, have a significant impact on bioremediation. This process relies on specific microorganisms native to particular regions. Consequently, a bioremediation approach successful in one location may not yield the same results elsewhere due to varying conditions. Customizing treatment strategies and continuously monitoring variables increase project complexity and may escalate expenses compared to conventional methods, potentially dissuading some users.
- Precisely predicting the outcomes of bioremediation poses a challenge due to numerous environmental factors and microbial activities at play. Consequently, project owners and investors seek reliable solutions with predictable timelines and costs, a daunting task given the inherent uncertainty. While modeling and monitoring efforts can mitigate some uncertainty, the unpredictable nature of natural systems prevents achieving absolute accuracy in predictions.
To Know More About This Report, Request a Free Sample Copy
KEY MARKET TRENDS
Global Bioremediation Technology and Services Market | Top Trends
- Nanotechnology is increasingly being utilized in bioremediation. By enhancing the absorption, transport, and reactivity of pollutants, nanomaterials, such as nanoparticles and nanocomposites, are employed to enhance the overall effectiveness of bioremediation procedures.
- Genomics and metagenomics have enabled researchers to explore microbial diversity and its functional potential. This exploration has led to innovative strategies for engineering microorganisms for various applications, including bioremediation, biofuel production, and pharmaceutical discovery.
MARKET SEGMENTATION
Market Segmentation – Type, Service, and Technology –
Market by Type:
- In-Situ Bioremediation
- In-situ bioremediation is the largest segment in the global bioremediation technology and services market by type.
- In-situ bioremediation involves treating contaminated or polluted sites on-site without removing materials. Microorganisms, such as bacteria or fungi, are introduced or stimulated in the affected area to break down and neutralize pollutants, converting them into less hazardous compounds.
- Additionally, the in-situ method is less disruptive and more economical than ex-situ treatments, making it a more common choice for soil and groundwater remediation.
- Ex-Situ Bioremediation
Market by Service:
- Soil Remediation
- Wastewater Remediation
- Oilfield Remediation
- Other Services
Market by Technology:
- Phytoremediation
- Biostimulation
- Biostimulation is anticipated to be the fastest-growing segment in the global bioremediation technology and services market by technology.
- As part of the bioremediation process, biostimulation involves adding extra nutrients to naturally occurring bacteria or stimulating the growth of selected ones. This stimulation enhances their metabolic activities, enabling them to more efficiently break down and destroy toxins in contaminated surroundings.
- Biostimulation is a sustainable approach that supports the natural breakdown of pollutants, thereby reducing environmental impact. It has proven effective for a variety of contaminants, including petroleum hydrocarbons, chlorinated solvents, and heavy metals. Moreover, this method minimizes infrastructure requirements, harnesses naturally occurring microorganisms, and allows for customization based on site conditions and contaminant types through nutrient adjustments. These features contribute to cost efficiency compared to alternative remediation methods.
- Bioaugmentation
- Bioreactors
- Fungal Remediation
- Land-Based Treatments
GEOGRAPHICAL STUDY
Geographical Study Based on Four Major Regions:- North America: The United States and Canada
- Government rules and policies in North America are likely to boost the region’s bioremediation technology and service market growth prospects. Both local and global organizations are actively supporting environmental conservation, with the U.S. Environmental Protection Agency being a notable example.
- Significant government funding for research and development in environmental technologies, including bioremediation, fosters innovation and market growth.
- The market is also receiving momentum from well-known companies such as Aquatech International, Xylem, RT Environmental Services, and others. These companies regularly introduce new products and make strategic moves, thereby increasing the demand for bioremediation products.
- Europe: The United Kingdom, Germany, France, Italy, Spain, Nordic Countries, and Rest of Europe
- Asia-Pacific: China, Japan, India, South Korea, Indonesia, Singapore, Taiwan, Australia & New Zealand, and Rest of Asia-Pacific
MAJOR PLAYERS
The major players in the global bioremediation technology and services market are:
- Aquatech International
- Carus Corporation LLC
- Drylet Inc
- Regenesis Remediation Solutions
- Ivey International Inc
- Probiosphere Inc
Key strategies adopted by some of these companies:
- In January 2023, Xylem Inc acquired Evoqua, a provider of essential water treatment technologies and services, along with being an emerging pollutants remediation company specializing in PFAS, for a total estimated value of $7.5 billion.
- In September 2023, Regenesis introduced the FluxTracer flux mapping tool, which utilizes DEXSORB for PFAS and chlorinated volatile organic compounds (CVOCs) contamination. Groundwater cleanup is imperative at numerous contaminated sites, and FluxTracers are employed to accurately monitor mass flux and groundwater velocity.
REPORT SYNOPSIS
| REPORT SCOPE | DETAILS |
|---|---|
| Market Forecast Years | 2024-2032 |
| Base Year | 2023 |
| Market Historical Years | 2018-2022 |
| Forecast Units | Revenue ($ Million) |
| Segments Analyzed | Type, Service, and Technology |
| Geographies Analyzed | North America, Europe, Asia-Pacific, and Rest of World |
| Companies Analyzed | Aquatech International, Carus Group Inc, Drylet Inc, InSitu Remediation Services Ltd, Ivey International Inc, Probiosphere Inc, Regenesis Remediation Solutions, RT Environmental Services Inc, Sarva Bio Remed LLC, Sevenson Environmental Services Inc, Soilutions Ltd, Sumas Environmental Services, Verde Environmental Group, Xylem Inc |
TABLE OF CONTENTS
RESEARCH SCOPE & METHODOLOGY
- STUDY OBJECTIVES
- METHODOLOGY
- ASSUMPTIONS & LIMITATIONS
EXECUTIVE SUMMARY
- MARKET SIZE & ESTIMATES
- MARKET OVERVIEW
- SCOPE OF STUDY
- CRISIS SCENARIO ANALYSIS
- MAJOR MARKET FINDINGS
MARKET DYNAMICS
- KEY DRIVERS
- INCREASED INDUSTRIALIZATION AND CORRESPONDING ENVIRONMENTAL DETERIORATION
- INCREASING GOVERNMENT INITIATIVES
- WIDENING APPLICATIONS IN THE COMMERCIAL SECTOR
- KEY RESTRAINTS
- LONG DURATION OF BIOREMEDIATION PROCESSES
- SITE-SPECIFIC VARIABILITY AND UNCERTAINTY
- KEY DRIVERS
KEY ANALYTICS
- KEY MARKET TRENDS
- GROWING INCORPORATION OF NANOTECHNOLOGY INTO BIOREMEDIATION PRACTICES
- INCREASING PROGRESS IN METAGENOMICS AND GENOMICS TO FIND & MODIFY MICROORGANISMS
- PORTER’S FIVE FORCES ANALYSIS
- BUYERS POWER
- SUPPLIERS POWER
- SUBSTITUTION
- NEW ENTRANTS
- INDUSTRY RIVALRY
- GROWTH PROSPECT MAPPING
- MARKET CONCENTRATION ANALYSIS
- VALUE CHAIN ANALYSIS
- SITE ASSESSMENT
- SELECTION AND MONITORING
- SITE RESTORATION
- KEY BUYING CRITERIA
- COST
- TIME
- PERFORMANCE
- KEY MARKET TRENDS
MARKET BY TYPE
- IN-SITU BIOREMEDIATION
- MARKET FORECAST FIGURE
- SEGMENT ANALYSIS
- EX-SITU BIOREMEDIATION
- MARKET FORECAST FIGURE
- SEGMENT ANALYSIS
- IN-SITU BIOREMEDIATION
MARKET BY SERVICE
- SOIL REMEDIATION
- MARKET FORECAST FIGURE
- SEGMENT ANALYSIS
- WASTEWATER REMEDIATION
- MARKET FORECAST FIGURE
- SEGMENT ANALYSIS
- OILFIELD REMEDIATION
- MARKET FORECAST FIGURE
- SEGMENT ANALYSIS
- OTHER SERVICES
- MARKET FORECAST FIGURE
- SEGMENT ANALYSIS
- SOIL REMEDIATION
MARKET BY TECHNOLOGY
- PHYTOREMEDIATION
- MARKET FORECAST FIGURE
- SEGMENT ANALYSIS
- BIOSTIMULATION
- MARKET FORECAST FIGURE
- SEGMENT ANALYSIS
- BIOAUGMENTATION
- MARKET FORECAST FIGURE
- SEGMENT ANALYSIS
- BIOREACTORS
- MARKET FORECAST FIGURE
- SEGMENT ANALYSIS
- FUNGAL REMEDIATION
- MARKET FORECAST FIGURE
- SEGMENT ANALYSIS
- LAND-BASED TREATMENTS
- MARKET FORECAST FIGURE
- SEGMENT ANALYSIS
- PHYTOREMEDIATION
GEOGRAPHICAL ANALYSIS
- NORTH AMERICA
- MARKET SIZE & ESTIMATES
- NORTH AMERICA BIOREMEDIATION TECHNOLOGY AND SERVICES MARKET DRIVERS
- NORTH AMERICA BIOREMEDIATION TECHNOLOGY AND SERVICES MARKET CHALLENGES
- KEY PLAYERS IN NORTH AMERICA BIOREMEDIATION TECHNOLOGY AND SERVICES MARKET
- COUNTRY ANALYSIS
- UNITED STATES
- UNITED STATES BIOREMEDIATION TECHNOLOGY AND SERVICES MARKET SIZE & OPPORTUNITIES
- CANADA
- CANADA BIOREMEDIATION TECHNOLOGY AND SERVICES MARKET SIZE & OPPORTUNITIES
- UNITED STATES
- EUROPE
- MARKET SIZE & ESTIMATES
- EUROPE BIOREMEDIATION TECHNOLOGY AND SERVICES MARKET DRIVERS
- EUROPE BIOREMEDIATION TECHNOLOGY AND SERVICES MARKET CHALLENGES
- KEY PLAYERS IN EUROPE BIOREMEDIATION TECHNOLOGY AND SERVICES MARKET
- COUNTRY ANALYSIS
- UNITED KINGDOM
- UNITED KINGDOM BIOREMEDIATION TECHNOLOGY AND SERVICES MARKET SIZE & OPPORTUNITIES
- GERMANY
- GERMANY BIOREMEDIATION TECHNOLOGY AND SERVICES MARKET SIZE & OPPORTUNITIES
- FRANCE
- FRANCE BIOREMEDIATION TECHNOLOGY AND SERVICES MARKET SIZE & OPPORTUNITIES
- ITALY
- ITALY BIOREMEDIATION TECHNOLOGY AND SERVICES MARKET SIZE & OPPORTUNITIES
- SPAIN
- SPAIN BIOREMEDIATION TECHNOLOGY AND SERVICES MARKET SIZE & OPPORTUNITIES
- NORDIC COUNTRIES
- NORDIC COUNTRIES BIOREMEDIATION TECHNOLOGY AND SERVICES MARKET SIZE & OPPORTUNITIES
- REST OF EUROPE
- REST OF EUROPE BIOREMEDIATION TECHNOLOGY AND SERVICES MARKET SIZE & OPPORTUNITIES
- UNITED KINGDOM
- ASIA-PACIFIC
- MARKET SIZE & ESTIMATES
- ASIA-PACIFIC BIOREMEDIATION TECHNOLOGY AND SERVICES MARKET DRIVERS
- ASIA-PACIFIC BIOREMEDIATION TECHNOLOGY AND SERVICES MARKET CHALLENGES
- KEY PLAYERS IN ASIA-PACIFIC BIOREMEDIATION TECHNOLOGY AND SERVICES MARKET
- COUNTRY ANALYSIS
- CHINA
- CHINA BIOREMEDIATION TECHNOLOGY AND SERVICES MARKET SIZE & OPPORTUNITIES
- JAPAN
- JAPAN BIOREMEDIATION TECHNOLOGY AND SERVICES MARKET SIZE & OPPORTUNITIES
- INDIA
- INDIA BIOREMEDIATION TECHNOLOGY AND SERVICES MARKET SIZE & OPPORTUNITIES
- SOUTH KOREA
- SOUTH KOREA BIOREMEDIATION TECHNOLOGY AND SERVICES MARKET SIZE & OPPORTUNITIES
- INDONESIA
- INDONESIA BIOREMEDIATION TECHNOLOGY AND SERVICES MARKET SIZE & OPPORTUNITIES
- SINGAPORE
- SINGAPORE BIOREMEDIATION TECHNOLOGY AND SERVICES MARKET SIZE & OPPORTUNITIES
- TAIWAN
- TAIWAN BIOREMEDIATION TECHNOLOGY AND SERVICES MARKET SIZE & OPPORTUNITIES
- AUSTRALIA & NEW ZEALAND
- AUSTRALIA & NEW ZEALAND BIOREMEDIATION TECHNOLOGY AND SERVICES MARKET SIZE & OPPORTUNITIES
- REST OF ASIA-PACIFIC
- REST OF ASIA-PACIFIC BIOREMEDIATION TECHNOLOGY AND SERVICES MARKET SIZE & OPPORTUNITIES
- CHINA
- REST OF WORLD
- MARKET SIZE & ESTIMATES
- REST OF WORLD BIOREMEDIATION TECHNOLOGY AND SERVICES MARKET DRIVERS
- REST OF WORLD BIOREMEDIATION TECHNOLOGY AND SERVICES MARKET CHALLENGES
- KEY PLAYERS IN REST OF WORLD BIOREMEDIATION TECHNOLOGY AND SERVICES MARKET
- REGIONAL ANALYSIS
- LATIN AMERICA
- LATIN AMERICA BIOREMEDIATION TECHNOLOGY AND SERVICES MARKET SIZE & OPPORTUNITIES
- MIDDLE EAST & AFRICA
- MIDDLE EAST & AFRICA BIOREMEDIATION TECHNOLOGY AND SERVICES MARKET SIZE & OPPORTUNITIES
- LATIN AMERICA
- NORTH AMERICA
COMPETITIVE LANDSCAPE
- KEY STRATEGIC DEVELOPMENTS
- MERGERS & ACQUISITIONS
- PRODUCT LAUNCHES & DEVELOPMENTS
- PARTNERSHIPS & AGREEMENTS
- COMPANY PROFILES
- AQUATECH INTERNATIONAL
- COMPANY OVERVIEW
- PRODUCTS LIST
- STRENGTHS & CHALLENGES
- CARUS GROUP INC
- COMPANY OVERVIEW
- PRODUCTS LIST
- STRENGTHS & CHALLENGES
- DRYLET INC
- COMPANY OVERVIEW
- PRODUCTS LIST
- STRENGTHS & CHALLENGES
- INSITU REMEDIATION SERVICES LTD
- COMPANY OVERVIEW
- PRODUCTS LIST
- STRENGTHS & CHALLENGES
- IVEY INTERNATIONAL INC
- COMPANY OVERVIEW
- PRODUCTS LIST
- STRENGTHS & CHALLENGES
- PROBIOSPHERE INC
- COMPANY OVERVIEW
- PRODUCTS LIST
- STRENGTHS & CHALLENGES
- REGENESIS REMEDIATION SOLUTIONS
- COMPANY OVERVIEW
- PRODUCTS LIST
- STRENGTHS & CHALLENGES
- RT ENVIRONMENTAL SERVICES INC
- COMPANY OVERVIEW
- PRODUCTS LIST
- STRENGTHS & CHALLENGES
- SARVA BIO REMED LLC
- COMPANY OVERVIEW
- PRODUCTS LIST
- STRENGTHS & CHALLENGES
- SEVENSON ENVIRONMENTAL SERVICES INC
- COMPANY OVERVIEW
- PRODUCTS LIST
- STRENGTHS & CHALLENGES
- SOILUTIONS LTD
- COMPANY OVERVIEW
- PRODUCTS LIST
- STRENGTHS & CHALLENGES
- SUMAS ENVIRONMENTAL SERVICES
- COMPANY OVERVIEW
- PRODUCTS LIST
- VERDE ENVIRONMENTAL GROUP
- COMPANY OVERVIEW
- PRODUCTS LIST
- XYLEM INC
- COMPANY OVERVIEW
- PRODUCTS LIST
- AQUATECH INTERNATIONAL
- KEY STRATEGIC DEVELOPMENTS
LIST OF TABLES
TABLE 1: MARKET SNAPSHOT – BIOREMEDIATION TECHNOLOGY AND SERVICES
TABLE 2: GLOBAL BIOREMEDIATION TECHNOLOGY AND SERVICES MARKET, BY TYPE, HISTORICAL YEARS, 2018-2022 (IN $ MILLION)
TABLE 3: GLOBAL BIOREMEDIATION TECHNOLOGY AND SERVICES MARKET, BY TYPE, FORECAST YEARS, 2024-2032 (IN $ MILLION)
TABLE 4: GLOBAL IN-SITU BIOREMEDIATION MARKET, BY REGION, HISTORICAL YEARS, 2018-2022 (IN $ MILLION)
TABLE 5: GLOBAL IN-SITU BIOREMEDIATION MARKET, BY REGION, FORECAST YEARS, 2024-2032 (IN $ MILLION)
TABLE 6: GLOBAL EX-SITU BIOREMEDIATION MARKET, BY REGION, HISTORICAL YEARS, 2018-2022 (IN $ MILLION)
TABLE 7: GLOBAL EX-SITU BIOREMEDIATION MARKET, BY REGION, FORECAST YEARS, 2024-2032 (IN $ MILLION)
TABLE 8: GLOBAL BIOREMEDIATION TECHNOLOGY AND SERVICES MARKET, BY SERVICE, HISTORICAL YEARS, 2018-2022 (IN $ MILLION)
TABLE 9: GLOBAL BIOREMEDIATION TECHNOLOGY AND SERVICES MARKET, BY SERVICE, FORECAST YEARS, 2024-2032 (IN $ MILLION)
TABLE 10: GLOBAL SOIL REMEDIATION MARKET, BY REGION, HISTORICAL YEARS, 2018-2022 (IN $ MILLION)
TABLE 11: GLOBAL SOIL REMEDIATION MARKET, BY REGION, FORECAST YEARS, 2024-2032 (IN $ MILLION)
TABLE 12: GLOBAL WASTEWATER REMEDIATION MARKET, BY REGION, HISTORICAL YEARS, 2018-2022 (IN $ MILLION)
TABLE 13: GLOBAL WASTEWATER REMEDIATION MARKET, BY REGION, FORECAST YEARS, 2024-2032 (IN $ MILLION)
TABLE 14: GLOBAL OILFIELD REMEDIATION MARKET, BY REGION, HISTORICAL YEARS, 2018-2022 (IN $ MILLION)
TABLE 15: GLOBAL OILFIELD REMEDIATION MARKET, BY REGION, FORECAST YEARS, 2024-2032 (IN $ MILLION)
TABLE 16: GLOBAL OTHER SERVICES MARKET, BY REGION, HISTORICAL YEARS, 2018-2022 (IN $ MILLION)
TABLE 17: GLOBAL OTHER SERVICES MARKET, BY REGION, FORECAST YEARS, 2024-2032 (IN $ MILLION)
TABLE 18: GLOBAL BIOREMEDIATION TECHNOLOGY AND SERVICES MARKET, BY TECHNOLOGY, HISTORICAL YEARS, 2018-2022 (IN $ MILLION)
TABLE 19: GLOBAL BIOREMEDIATION TECHNOLOGY AND SERVICES MARKET, BY TECHNOLOGY, FORECAST YEARS, 2024-2032 (IN $ MILLION)
TABLE 20: GLOBAL PHYTOREMEDIATION MARKET, BY REGION, HISTORICAL YEARS, 2018-2022 (IN $ MILLION)
TABLE 21: GLOBAL PHYTOREMEDIATION MARKET, BY REGION, FORECAST YEARS, 2024-2032 (IN $ MILLION)
TABLE 22: GLOBAL BIOSTIMULATION MARKET, BY REGION, HISTORICAL YEARS, 2018-2022 (IN $ MILLION)
TABLE 23: GLOBAL BIOSTIMULATION MARKET, BY REGION, FORECAST YEARS, 2024-2032 (IN $ MILLION)
TABLE 24: GLOBAL BIOAUGMENTATION MARKET, BY REGION, HISTORICAL YEARS, 2018-2022 (IN $ MILLION)
TABLE 25: GLOBAL BIOAUGMENTATION MARKET, BY REGION, FORECAST YEARS, 2024-2032 (IN $ MILLION)
TABLE 26: GLOBAL BIOREACTORS MARKET, BY REGION, HISTORICAL YEARS, 2018-2022 (IN $ MILLION)
TABLE 27: GLOBAL BIOREACTORS MARKET, BY REGION, FORECAST YEARS, 2024-2032 (IN $ MILLION)
TABLE 28: GLOBAL FUNGAL REMEDIATION MARKET, BY REGION, HISTORICAL YEARS, 2018-2022 (IN $ MILLION)
TABLE 29: GLOBAL FUNGAL REMEDIATION MARKET, BY REGION, FORECAST YEARS, 2024-2032 (IN $ MILLION)
TABLE 30: GLOBAL LAND-BASED TREATMENTS MARKET, BY REGION, HISTORICAL YEARS, 2018-2022 (IN $ MILLION)
TABLE 31: GLOBAL LAND-BASED TREATMENTS MARKET, BY REGION, FORECAST YEARS, 2024-2032 (IN $ MILLION)
TABLE 32: GLOBAL BIOREMEDIATION TECHNOLOGY AND SERVICES MARKET, BY GEOGRAPHY, HISTORICAL YEARS, 2018-2022 (IN $ MILLION)
TABLE 33: GLOBAL BIOREMEDIATION TECHNOLOGY AND SERVICES MARKET, BY GEOGRAPHY, FORECAST YEARS, 2024-2032 (IN $ MILLION)
TABLE 34: NORTH AMERICA BIOREMEDIATION TECHNOLOGY AND SERVICES MARKET, BY COUNTRY, HISTORICAL YEARS, 2018-2022 (IN $ MILLION)
TABLE 35: NORTH AMERICA BIOREMEDIATION TECHNOLOGY AND SERVICES MARKET, BY COUNTRY, FORECAST YEARS, 2024-2032 (IN $ MILLION)
TABLE 36: KEY PLAYERS OPERATING IN NORTH AMERICA BIOREMEDIATION TECHNOLOGY AND SERVICES MARKET
TABLE 37: EUROPE BIOREMEDIATION TECHNOLOGY AND SERVICES MARKET, BY COUNTRY, HISTORICAL YEARS, 2018-2022 (IN $ MILLION)
TABLE 38: EUROPE BIOREMEDIATION TECHNOLOGY AND SERVICES MARKET, BY COUNTRY, FORECAST YEARS, 2024-2032 (IN $ MILLION)
TABLE 39: KEY PLAYERS OPERATING IN EUROPE BIOREMEDIATION TECHNOLOGY AND SERVICES MARKET
TABLE 40: ASIA-PACIFIC BIOREMEDIATION TECHNOLOGY AND SERVICES MARKET, BY COUNTRY, HISTORICAL YEARS, 2018-2022 (IN $ MILLION)
TABLE 41: ASIA-PACIFIC BIOREMEDIATION TECHNOLOGY AND SERVICES MARKET, BY COUNTRY, FORECAST YEARS, 2024-2032 (IN $ MILLION)
TABLE 42: KEY PLAYERS OPERATING IN ASIA-PACIFIC BIOREMEDIATION TECHNOLOGY AND SERVICES MARKET
TABLE 43: REST OF WORLD BIOREMEDIATION TECHNOLOGY AND SERVICES MARKET, BY REGION, HISTORICAL YEARS, 2018-2022 (IN $ MILLION)
TABLE 44: REST OF WORLD BIOREMEDIATION TECHNOLOGY AND SERVICES MARKET, BY REGION, FORECAST YEARS, 2024-2032 (IN $ MILLION)
TABLE 45: KEY PLAYERS OPERATING IN REST OF WORLD BIOREMEDIATION TECHNOLOGY AND SERVICES MARKET
TABLE 46: LIST OF MERGERS & ACQUISITIONS
TABLE 47: LIST OF PRODUCT LAUNCHES & DEVELOPMENTS
TABLE 48: LIST OF PARTNERSHIPS & AGREEMENTS
LIST OF FIGURES
FIGURE 1: KEY MARKET TRENDS
FIGURE 2: PORTER’S FIVE FORCES ANALYSIS
FIGURE 3: GROWTH PROSPECT MAPPING FOR NORTH AMERICA
FIGURE 4: GROWTH PROSPECT MAPPING FOR EUROPE
FIGURE 5: GROWTH PROSPECT MAPPING FOR ASIA-PACIFIC
FIGURE 6: GROWTH PROSPECT MAPPING FOR REST OF WORLD
FIGURE 7: MARKET CONCENTRATION ANALYSIS
FIGURE 8: VALUE CHAIN ANALYSIS
FIGURE 9: KEY BUYING CRITERIA
FIGURE 10: GLOBAL BIOREMEDIATION TECHNOLOGY AND SERVICES MARKET, GROWTH POTENTIAL, BY TYPE, IN 2023
FIGURE 11: GLOBAL BIOREMEDIATION TECHNOLOGY AND SERVICES MARKET, BY IN-SITU BIOREMEDIATION, 2024-2032 (IN $ MILLION)
FIGURE 12: GLOBAL BIOREMEDIATION TECHNOLOGY AND SERVICES MARKET, BY EX-SITU BIOREMEDIATION, 2024-2032 (IN $ MILLION)
FIGURE 13: GLOBAL BIOREMEDIATION TECHNOLOGY AND SERVICES MARKET, GROWTH POTENTIAL, BY SERVICE, IN 2023
FIGURE 14: GLOBAL BIOREMEDIATION TECHNOLOGY AND SERVICES MARKET, BY SOIL REMEDIATION, 2024-2032 (IN $ MILLION)
FIGURE 15: GLOBAL BIOREMEDIATION TECHNOLOGY AND SERVICES MARKET, BY WASTEWATER REMEDIATION, 2024-2032 (IN $ MILLION)
FIGURE 16: GLOBAL BIOREMEDIATION TECHNOLOGY AND SERVICES MARKET, BY OILFIELD REMEDIATION, 2024-2032 (IN $ MILLION)
FIGURE 17: GLOBAL BIOREMEDIATION TECHNOLOGY AND SERVICES MARKET, BY OTHER SERVICES, 2024-2032 (IN $ MILLION)
FIGURE 18: GLOBAL BIOREMEDIATION TECHNOLOGY AND SERVICES MARKET, GROWTH POTENTIAL, BY TECHNOLOGY, IN 2023
FIGURE 19: GLOBAL BIOREMEDIATION TECHNOLOGY AND SERVICES MARKET, BY PHYTOREMEDIATION, 2024-2032 (IN $ MILLION)
FIGURE 20: GLOBAL BIOREMEDIATION TECHNOLOGY AND SERVICES MARKET, BY BIOSTIMULATION, 2024-2032 (IN $ MILLION)
FIGURE 21: GLOBAL BIOREMEDIATION TECHNOLOGY AND SERVICES MARKET, BY BIOAUGMENTATION, 2024-2032 (IN $ MILLION)
FIGURE 22: GLOBAL BIOREMEDIATION TECHNOLOGY AND SERVICES MARKET, BY BIOREACTORS, 2024-2032 (IN $ MILLION)
FIGURE 23: GLOBAL BIOREMEDIATION TECHNOLOGY AND SERVICES MARKET, BY FUNGAL REMEDIATION, 2024-2032 (IN $ MILLION)
FIGURE 24: GLOBAL BIOREMEDIATION TECHNOLOGY AND SERVICES MARKET, BY LAND-BASED TREATMENTS, 2024-2032 (IN $ MILLION)
FIGURE 25: NORTH AMERICA BIOREMEDIATION TECHNOLOGY AND SERVICES MARKET, COUNTRY OUTLOOK, 2023 & 2032 (IN %)
FIGURE 26: UNITED STATES BIOREMEDIATION TECHNOLOGY AND SERVICES MARKET, 2024-2032 (IN $ MILLION)
FIGURE 27: CANADA BIOREMEDIATION TECHNOLOGY AND SERVICES MARKET, 2024-2032 (IN $ MILLION)
FIGURE 28: EUROPE BIOREMEDIATION TECHNOLOGY AND SERVICES MARKET, COUNTRY OUTLOOK, 2023 & 2032 (IN %)
FIGURE 29: UNITED KINGDOM BIOREMEDIATION TECHNOLOGY AND SERVICES MARKET, 2024-2032 (IN $ MILLION)
FIGURE 30: GERMANY BIOREMEDIATION TECHNOLOGY AND SERVICES MARKET, 2024-2032 (IN $ MILLION)
FIGURE 31: FRANCE BIOREMEDIATION TECHNOLOGY AND SERVICES MARKET, 2024-2032 (IN $ MILLION)
FIGURE 32: ITALY BIOREMEDIATION TECHNOLOGY AND SERVICES MARKET, 2024-2032 (IN $ MILLION)
FIGURE 33: SPAIN BIOREMEDIATION TECHNOLOGY AND SERVICES MARKET, 2024-2032 (IN $ MILLION)
FIGURE 34: NORDIC COUNTRIES BIOREMEDIATION TECHNOLOGY AND SERVICES MARKET, 2024-2032 (IN $ MILLION)
FIGURE 35: REST OF EUROPE BIOREMEDIATION TECHNOLOGY AND SERVICES MARKET, 2024-2032 (IN $ MILLION)
FIGURE 36: ASIA-PACIFIC BIOREMEDIATION TECHNOLOGY AND SERVICES MARKET, COUNTRY OUTLOOK, 2023 & 2032 (IN %)
FIGURE 37: CHINA BIOREMEDIATION TECHNOLOGY AND SERVICES MARKET, 2024-2032 (IN $ MILLION)
FIGURE 38: JAPAN BIOREMEDIATION TECHNOLOGY AND SERVICES MARKET, 2024-2032 (IN $ MILLION)
FIGURE 39: INDIA BIOREMEDIATION TECHNOLOGY AND SERVICES MARKET, 2024-2032 (IN $ MILLION)
FIGURE 40: SOUTH KOREA BIOREMEDIATION TECHNOLOGY AND SERVICES MARKET, 2024-2032 (IN $ MILLION)
FIGURE 41: INDONESIA BIOREMEDIATION TECHNOLOGY AND SERVICES MARKET, 2024-2032 (IN $ MILLION)
FIGURE 42: SINGAPORE BIOREMEDIATION TECHNOLOGY AND SERVICES MARKET, 2024-2032 (IN $ MILLION)
FIGURE 43: TAIWAN BIOREMEDIATION TECHNOLOGY AND SERVICES MARKET, 2024-2032 (IN $ MILLION)
FIGURE 44: AUSTRALIA & NEW ZEALAND BIOREMEDIATION TECHNOLOGY AND SERVICES MARKET, 2024-2032 (IN $ MILLION)
FIGURE 45: REST OF ASIA-PACIFIC BIOREMEDIATION TECHNOLOGY AND SERVICES MARKET, 2024-2032 (IN $ MILLION)
FIGURE 46: REST OF WORLD BIOREMEDIATION TECHNOLOGY AND SERVICES MARKET, REGIONAL OUTLOOK, 2023 & 2032 (IN %)
FIGURE 47: LATIN AMERICA BIOREMEDIATION TECHNOLOGY AND SERVICES MARKET, 2024-2032 (IN $ MILLION)
FIGURE 48: MIDDLE EAST & AFRICA BIOREMEDIATION TECHNOLOGY AND SERVICES MARKET, 2024-2032 (IN $ MILLION)
FAQ’s
FAQs
Bioremediation is crucial for environmental conservation as it provides an eco-friendly approach to clean up and restore contaminated sites. It leverages natural processes, minimizing environmental impact and promoting the sustainable management of ecosystems.
Several factors may limit the widespread adoption of bioremediation technologies, including site-specific challenges, regulatory constraints, and the complexity of contaminant compositions. Overcoming these limitations requires tailored strategies and continuous innovation.
Bioremediation products can include microorganisms, such as bacteria and fungi, alongside nutrients, bioreactors, and biostimulants.
RELATED REPORTS
-

GLOBAL REVERSE OSMOSIS COMPONENTS MARKET FORECAST 2025-2032
-

ASIA-PACIFIC REVERSE OSMOSIS COMPONENTS MARKET FORECAST 2025-2032
-

EUROPE REVERSE OSMOSIS COMPONENTS MARKET FORECAST 2025-2032
-

NORTH AMERICA REVERSE OSMOSIS COMPONENTS MARKET FORECAST 2025-2032
-

SINGAPORE REVERSE OSMOSIS COMPONENTS MARKET FORECAST 2025-2032
-
SOUTH AFRICA REVERSE OSMOSIS COMPONENTS MARKET FORECAST 2025-2032
-

SAUDI ARABIA REVERSE OSMOSIS COMPONENTS MARKET FORECAST 2025-2032
-

GLOBAL BIPV GLASS MARKET FORECAST 2024-2032
-

ASIA-PACIFIC BIPV GLASS MARKET FORECAST 2024-2032
-
EUROPE BIPV GLASS MARKET FORECAST 2024-2032