

GLOBAL IMMUNOSUPPRESSANT DRUGS MARKET FORECAST 2019-2028
Global Immunosuppressant Drugs Market by Distribution Channel (Hospital Pharmacies, Retail Pharmacies, Online Pharmacies) by End-user (Organ Transplantation, Autoimmune Disorders, Others) by Drug Class (Corticosteroids, Monoclonal Antibodies, Calcineurin Inhibitors, Mtor Inhibitors, Others) and by Geography.
The global immunosuppressant drugs market is estimated to grow with a CAGR of 4.17%, during the year 2019-2028. The market is anticipated to reach revenue of about $15257.99 Million by 2028. The base year considered for the study is 2018, while the projected period is between 2019 and 2028.
The market growth is propelled by the following factors:
- Increase in the number of autoimmune disorders
- Rise in organ transplantation
- Growth in the pharmaceutical industry
To learn more about this report, request a free sample copy
The main market driver is the rise in the number of organ transplantation. Immunosuppressant drugs form an important role in organ transplantation. Because of a genetic condition such as polycystic kidney disease, cystic fibrosis, or heart defect, many people need an organ transplant. Infections such as hepatitis, physical injury to organs, and damage caused by chronic conditions such as diabetes, can also call for a transplant. Drugs are commonly used during the hyperimmune hypertransplantation process. According to the WHO, about 139,024 organs were transplanted in 2017, a 7.25 percent leap from 2015. It can also be said that there were roughly 16 transplants per hour in 2017.
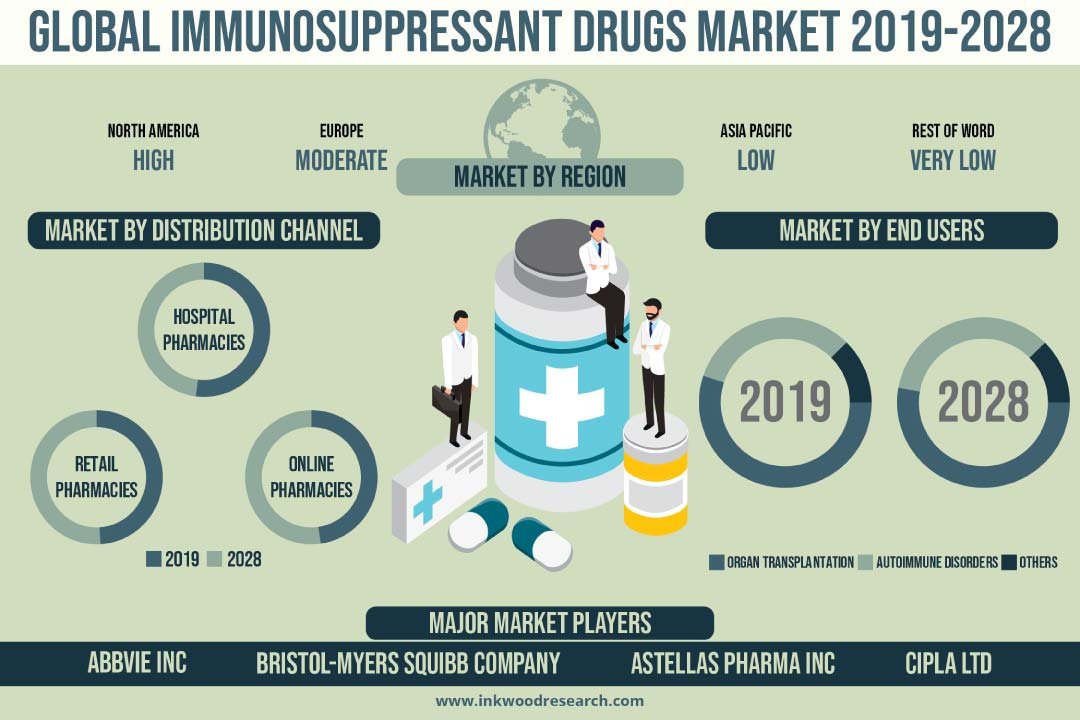
The hospital pharmacies category in the distribution channel segment captured the largest market share of 45.11% in 2019. Hospital pharmacies are generally found within the premises of a hospital. Hospital pharmacies chiefly provide medications for hospitalized patients, and not to retail establishments. As the hospital pharmacies cater to the drug requirement for surgical operations, and organ transplantation being a major end user for the market, the hospital pharmacies capture a large market share.
The fastest-growing distribution channel is expected to be online pharmacies, registering a CAGR of 5.20%. Most of the online pharmacies not only deliver medicines, but also interact with patients regarding suitable medications for specific indications, and interacts with health insurers for billing purposes. This makes the distribution path of drugs more convenient and increases the accessibility of newly launched immunosuppressive drugs in the market.
The market growth constraints include the side effects of immunosuppressant drugs and a lack of awareness about organ donation. Organ transplantation forms around 50 percent of the market share. Hence, its impact on the immunosuppression market is significant. Though the surge in demand for organ transplantation is on the rise, lack of awareness toward the same has been witnessed. Individuals are not aware of organ donation, and this can be witnessed in developed as well as developing countries.
The report on the global immunosuppressant drugs market includes the segmentation analysis of distribution channel, end-user, and drug class.
Market by Distribution Channel:
- Hospital Pharmacies
- Retail Pharmacies
- Online Pharmacies
Market by End-user:
- Organ Transplantation
- Autoimmune Disorders
- Others
Market by Drug Class:
- Corticosteroids
- Monoclonal Antibodies
- Calcineurin Inhibitors
- mTOR Inhibitors
- Others
Geographically, the global immunosuppressant drugs market has been segmented on the basis of four major regions, which includes:
- North America: the United States & Canada
- Europe: the United Kingdom, Germany, France, Italy, Russia, Belgium, Poland, and Rest of Europe
- Asia Pacific: China, Japan, India, South Korea, Indonesia, Thailand, Vietnam, Australia & New Zealand, and Rest of Asia Pacific
- Rest of World: Latin America, the Middle East & Africa
The region of North America dominated the global market in 2019, harboring a market share of 42.27%. The factors that drive the overall growth of the North American immunosuppressants market include the increasing government funds for R&D of novel immunosuppressants as well as a surge in prevalence of auto-immune diseases such as irritable bowel syndrome and Crohn’s disease. Furthermore, an increase in demand for organ transplantation due to a surge in organ failure incidences, including heart, kidney, and liver in this region, drives the market growth for immunosuppressants.
The Asia Pacific region is set to register the highest CAGR by the end of the forecast period. This region entails densely populated countries like China and India. Its growth is complemented by a rise in demand for healthcare services, an increase in the number of hospitals in developing countries, an increase in the R&D sector, an increase in healthcare reforms, and technical developments in the healthcare sector. Moreover, India and China are expected to grow with the fastest CAGR during the forecast period due to the presence of the highest population base, a significant increase in demand for rapid diagnosis of autoimmune diseases, and an increase in the pharmaceutical sector R&D activities in the region.
The major market players in the global immunosuppressant drugs market include:
- Astellas Pharma Inc
- Sanofi SA
- Novartis International AG
- Mylan NV
- Bristol-Myers Squibb
- Pfizer Inc
Company Profiles covers the analysis of important players. These companies are using organic and inorganic strategies for growth. For instance, in May 2020, AbbVie completed its acquisition of Allergan Plc. In February 2019, Roche and Spark Therapeutics entered into a merger agreement, under which Roche will acquire Spark Therapeutics. In February 2019, Allergan acquired Elastagen for US$95 million.
Key findings of the global immunosuppressant drugs market are:
- COVID-19 is affecting glomerular and kidney transplant recipients.
- There are intense growth opportunities in emerging economies.
- There is a rise in the exports of drugs and medicine worldwide.
- Organ transplantation captures the largest market share in the end-user segment.
- RESEARCH SCOPE & METHODOLOGY
- STUDY OBJECTIVES
- SCOPE OF STUDY
- METHODOLOGY
- ASSUMPTIONS & LIMITATIONS
- EXECUTIVE SUMMARY
- MARKET SIZE & ESTIMATES
- MARKET OVERVIEW
- MARKET DYNAMICS
- DEVELOPMENT OF IMMUNOSUPPRESSANT DRUGS
- MARKET DEFINITION
- KEY DRIVERS
- INCREASE IN THE NUMBER OF AUTOIMMUNE DISORDERS
- RISE IN ORGAN TRANSPLANTATION
- GROWTH IN THE PHARMACEUTICAL INDUSTRY
- KEY RESTRAINTS
- SIDE EFFECTS OF IMMUNOSUPPRESSANT DRUGS
- LACK OF AWARENESS ABOUT ORGAN DONATION
- KEY ANALYTICS
- KEY INVESTMENT INSIGHTS
- PORTER’S FIVE FORCE ANALYSIS
- BUYER POWER
- SUPPLIER POWER
- SUBSTITUTION
- NEW ENTRANTS
- INDUSTRY RIVALRY
- OPPORTUNITY MATRIX
- VENDOR LANDSCAPE
- MARKET BY DISTRIBUTION CHANNEL
- HOSPITAL PHARMACIES
- RETAIL PHARMACIES
- ONLINE PHARMACIES
- MARKET BY END-USER
- ORGAN TRANSPLANTATION
- AUTOIMMUNE DISORDERS
- OTHERS
- MARKET BY DRUG CLASS
- CORTICOSTEROIDS
- MONOCLONAL ANTIBODIES
- CALCINEURIN INHIBITORS
- MTOR INHIBITORS
- OTHERS
- GEOGRAPHICAL ANALYSIS
- NORTH AMERICA
- UNITED STATES
- CANADA
- EUROPE
- UNITED KINGDOM
- GERMANY
- FRANCE
- ITALY
- RUSSIA
- BELGIUM
- POLAND
- REST OF EUROPE
- ASIA PACIFIC
- CHINA
- JAPAN
- INDIA
- SOUTH KOREA
- INDONESIA
- THAILAND
- VIETNAM
- AUSTRALIA & NEW ZEALAND
- REST OF ASIA PACIFIC
- REST OF WORLD
- LATIN AMERICA
- MIDDLE EAST & AFRICA
- NORTH AMERICA
- COMPANY PROFILES
- ABBVIE INC
- ALLERGAN PLC (ACQUIRED BY ABVIE INC)
- ASTELLAS PHARMA INC
- BRISTOL-MYERS SQUIBB COMPANY
- CIPLA LTD
- REDDY’S LABORATORIES LTD
- F HOFFMANN-LA ROCHE AG
- GLAXOSMITHKLINE PLC
- INTAS PHARMACEUTICALS LTD (ACCORD HEALTHCARE LTD)
- JANSSEN PHARMACEUTICALS NV (JHONSON & JHONSON)
- MYLAN NV
- NOVARTIS INTERNATIONAL AG (SANDOZ)
- PFIZER INC
- SANOFI SA
- VELOXIS PHARMACEUTICALS
TABLE LIST
TABLE 1: MARKET SNAPSHOT – IMMUNOSUPPRESSANT DRUGS
TABLE 2: SIDE EFFECTS OF IMMUNOSUPPRESSANT DRUGS
TABLE 3: TOP 15 POSITIVE NET EXPORTS COUNTRIES AND NEGATIVE NET EXPORTS FOR DRUGS & MEDICINES COUNTRIES
TABLE 4: GLOBAL IMMUNOSUPPRESSANT DRUGS MARKET, BY DISTRIBUTION CHANNEL, HISTORICAL YEARS, 2016-2019 (IN $ MILLION)
TABLE 5: GLOBAL IMMUNOSUPPRESSANT DRUGS MARKET, BY DISTRIBUTION CHANNEL, FORECAST YEARS, 2019-2028 (IN $ MILLION)
TABLE 6: GLOBAL HOSPITAL PHARMACIES MARKET, BY REGION, HISTORICAL YEARS, 2016-2019 (IN $ MILLION)
TABLE 7: GLOBAL HOSPITAL PHARMACIES MARKET, BY REGION, FORECAST YEARS, 2019-2028 (IN $ MILLION)
TABLE 8: GLOBAL RETAIL PHARMACIES MARKET, BY REGION, HISTORICAL YEARS, 2016-2019 (IN $ MILLION)
TABLE 9: GLOBAL RETAIL PHARMACIES MARKET, BY REGION, FORECAST YEARS, 2019-2028 (IN $ MILLION)
TABLE 10: GLOBAL ONLINE PHARMACIES MARKET, BY REGION, HISTORICAL YEARS, 2016-2019 (IN $ MILLION)
TABLE 11: GLOBAL ONLINE PHARMACIES MARKET, BY REGION, FORECAST YEARS, 2019-2028 (IN $ MILLION)
TABLE 12: GLOBAL IMMUNOSUPPRESSANT DRUGS MARKET, BY END-USER, HISTORICAL YEARS, 2016-2019 (IN $ MILLION)
TABLE 13: GLOBAL IMMUNOSUPPRESSANT DRUGS MARKET, BY END-USER, FORECAST YEARS, 2019-2028 (IN $ MILLION)
TABLE 14: GLOBAL ORGAN TRANSPLANTATION MARKET, BY REGION, HISTORICAL YEARS, 2016-2019 (IN $ MILLION)
TABLE 15: GLOBAL ORGAN TRANSPLANTATION MARKET, BY REGION, FORECAST YEARS, 2019-2028 (IN $ MILLION)
TABLE 16: GLOBAL AUTOIMMUNE DISORDERS MARKET, BY REGION, HISTORICAL YEARS, 2016-2019 (IN $ MILLION)
TABLE 17: GLOBAL AUTOIMMUNE DISORDERS MARKET, BY REGION, FORECAST YEARS, 2019-2028 (IN $ MILLION)
TABLE 18: GLOBAL OTHERS MARKET, BY REGION, HISTORICAL YEARS, 2016-2019 (IN $ MILLION)
TABLE 19: GLOBAL OTHERS MARKET, BY REGION, FORECAST YEARS, 2019-2028 (IN $ MILLION)
TABLE 20: GLOBAL IMMUNOSUPPRESSANT DRUGS MARKET, BY CLASS, HISTORICAL YEARS, 2016-2019 (IN $ MILLION)
TABLE 21: GLOBAL IMMUNOSUPPRESSANT DRUGS MARKET, BY CLASS, FORECAST YEARS, 2019-2028 (IN $ MILLION)
TABLE 22: GLOBAL CORTICOSTEROIDS MARKET, BY REGION, HISTORICAL YEARS, 2016-2019 (IN $ MILLION)
TABLE 23: GLOBAL CORTICOSTEROIDS MARKET, BY REGION, FORECAST YEARS, 2019-2028 (IN $ MILLION)
TABLE 24: GLOBAL MONOCLONAL ANTIBODIES MARKET, BY REGION, HISTORICAL YEARS, 2016-2019 (IN $ MILLION)
TABLE 25: GLOBAL MONOCLONAL ANTIBODIES MARKET, BY REGION, FORECAST YEARS, 2019-2028 (IN $ MILLION)
TABLE 26: GLOBAL CALCINEURIN INHIBITORS MARKET, BY REGION, HISTORICAL YEARS, 2016-2019 (IN $ MILLION)
TABLE 27: GLOBAL CALCINEURIN INHIBITORS MARKET, BY REGION, FORECAST YEARS, 2019-2028 (IN $ MILLION)
TABLE 28: GLOBAL MTOR INHIBITORS MARKET, BY REGION, HISTORICAL YEARS, 2016-2019 (IN $ MILLION)
TABLE 29: GLOBAL MTOR INHIBITORS MARKET, BY REGION, FORECAST YEARS, 2019-2028 (IN $ MILLION)
TABLE 30: GLOBAL OTHERS MARKET, BY REGION, HISTORICAL YEARS, 2016-2019 (IN $ MILLION)
TABLE 31: GLOBAL OTHERS MARKET, BY REGION, FORECAST YEARS, 2019-2028 (IN $ MILLION)
TABLE 32: GLOBAL IMMUNOSUPPRESSANT DRUGS MARKET, BY GEOGRAPHY, HISTORICAL YEARS, 2016-2019 (IN $ MILLION)
TABLE 33: GLOBAL IMMUNOSUPPRESSANT DRUGS MARKET, BY GEOGRAPHY, FORECAST YEARS, 2019-2028 (IN $ MILLION)
TABLE 34: NORTH AMERICA IMMUNOSUPPRESSANT DRUGS MARKET, BY COUNTRY, HISTORICAL YEARS, 2016-2019 (IN $ MILLION)
TABLE 35: NORTH AMERICA IMMUNOSUPPRESSANT DRUGS MARKET, BY COUNTRY, FORECAST YEARS, 2019-2028 (IN $ MILLION)
TABLE 36: EUROPE IMMUNOSUPPRESSANT DRUGS MARKET, BY COUNTRY, HISTORICAL YEARS, 2016-2019 (IN $ MILLION)
TABLE 37: EUROPE IMMUNOSUPPRESSANT DRUGS MARKET, BY COUNTRY, FORECAST YEARS, 2019-2028 (IN $ MILLION)
TABLE 38: ASIA PACIFIC IMMUNOSUPPRESSANT DRUGS MARKET, BY COUNTRY, HISTORICAL YEARS, 2016-2019 (IN $ MILLION)
TABLE 39: ASIA PACIFIC IMMUNOSUPPRESSANT DRUGS MARKET, BY COUNTRY, FORECAST YEARS, 2019-2028 (IN $ MILLION)
TABLE 40: REST OF WORLD IMMUNOSUPPRESSANT DRUGS MARKET, BY REGION, HISTORICAL YEARS, 2016-2019 (IN $ MILLION)
TABLE 41: REST OF WORLD IMMUNOSUPPRESSANT DRUGS MARKET, BY REGION, FORECAST YEARS, 2019-2028 (IN $ MILLION)
FIGURE LIST
FIGURE 1: DEVELOPMENT OF IMMUNOSUPPRESSANT DRUGS
FIGURE 2: KEY INVESTMENT INSIGHTS
FIGURE 3: PORTER’S FIVE FORCE ANALYSIS
FIGURE 4: OPPORTUNITY MATRIX
FIGURE 5: VENDOR LANDSCAPE
FIGURE 6: GLOBAL IMMUNOSUPPRESSANT DRUGS MARKET, GROWTH POTENTIAL, BY DISTRIBUTION CHANNEL, IN 2019
FIGURE 7: GLOBAL IMMUNOSUPPRESSANT DRUGS MARKET, BY HOSPITAL PHARMACIES, 2019-2028 (IN $ MILLION)
FIGURE 8: GLOBAL IMMUNOSUPPRESSANT DRUGS MARKET, BY RETAIL PHARMACIES, 2019-2028 (IN $ MILLION)
FIGURE 9: GLOBAL IMMUNOSUPPRESSANT DRUGS MARKET, BY ONLINE PHARMACIES, 2019-2028 (IN $ MILLION)
FIGURE 10: GLOBAL IMMUNOSUPPRESSANT DRUGS MARKET, GROWTH POTENTIAL, BY END-USER, IN 2019
FIGURE 11: GLOBAL IMMUNOSUPPRESSANT DRUGS MARKET, BY ORGAN TRANSPLANTATION, 2019-2028 (IN $ MILLION)
FIGURE 12: GLOBAL IMMUNOSUPPRESSANT DRUGS MARKET, BY AUTOIMMUNE DISORDERS, 2019-2028 (IN $ MILLION)
FIGURE 13: GLOBAL IMMUNOSUPPRESSANT DRUGS MARKET, BY OTHERS, 2019-2028 (IN $ MILLION)
FIGURE 14: GLOBAL IMMUNOSUPPRESSANT DRUGS MARKET, GROWTH POTENTIAL, BY CLASS, IN 2019
FIGURE 15: GLOBAL IMMUNOSUPPRESSANT DRUGS MARKET, BY CORTICOSTEROIDS, 2019-2028 (IN $ MILLION)
FIGURE 16: GLOBAL IMMUNOSUPPRESSANT DRUGS MARKET, BY MONOCLONAL ANTIBODIES, 2019-2028 (IN $ MILLION)
FIGURE 17: GLOBAL IMMUNOSUPPRESSANT DRUGS MARKET, BY CALCINEURIN INHIBITORS, 2019-2028 (IN $ MILLION)
FIGURE 18: GLOBAL IMMUNOSUPPRESSANT DRUGS MARKET, BY MTOR INHIBITORS, 2019-2028 (IN $ MILLION)
FIGURE 19: GLOBAL IMMUNOSUPPRESSANT DRUGS MARKET, BY OTHERS, 2019-2028 (IN $ MILLION)
FIGURE 20: NORTH AMERICA IMMUNOSUPPRESSANT DRUGS MARKET, REGIONAL OUTLOOK, 2019 & 2028 (IN %)
FIGURE 21: UNITED STATES IMMUNOSUPPRESSANT DRUGS MARKET, 2019-2028 (IN $ MILLION)
FIGURE 22: CANADA IMMUNOSUPPRESSANT DRUGS MARKET, 2019-2028 (IN $ MILLION)
FIGURE 23: EUROPE IMMUNOSUPPRESSANT DRUGS MARKET, REGIONAL OUTLOOK, 2019 & 2028 (IN %)
FIGURE 24: UNITED KINGDOM IMMUNOSUPPRESSANT DRUGS MARKET, 2019-2028 (IN $ MILLION)
FIGURE 25: GERMANY IMMUNOSUPPRESSANT DRUGS MARKET, 2019-2028 (IN $ MILLION)
FIGURE 26: FRANCE IMMUNOSUPPRESSANT DRUGS MARKET, 2019-2028 (IN $ MILLION)
FIGURE 27: ITALY IMMUNOSUPPRESSANT DRUGS MARKET, 2019-2028 (IN $ MILLION)
FIGURE 28: RUSSIA IMMUNOSUPPRESSANT DRUGS MARKET, 2019-2028 (IN $ MILLION)
FIGURE 29: BELGIUM IMMUNOSUPPRESSANT DRUGS MARKET, 2019-2028 (IN $ MILLION)
FIGURE 30: POLAND IMMUNOSUPPRESSANT DRUGS MARKET, 2019-2028 (IN $ MILLION)
FIGURE 31: REST OF EUROPE IMMUNOSUPPRESSANT DRUGS MARKET, 2019-2028 (IN $ MILLION)
FIGURE 32: ASIA PACIFIC IMMUNOSUPPRESSANT DRUGS MARKET, REGIONAL OUTLOOK, 2019 & 2028 (IN %)
FIGURE 33: CHINA IMMUNOSUPPRESSANT DRUGS MARKET, 2019-2028 (IN $ MILLION)
FIGURE 34: JAPAN IMMUNOSUPPRESSANT DRUGS MARKET, 2019-2028 (IN $ MILLION)
FIGURE 35: INDIA IMMUNOSUPPRESSANT DRUGS MARKET, 2019-2028 (IN $ MILLION)
FIGURE 36: SOUTH KOREA IMMUNOSUPPRESSANT DRUGS MARKET, 2019-2028 (IN $ MILLION)
FIGURE 37: INDONESIA IMMUNOSUPPRESSANT DRUGS MARKET, 2019-2028 (IN $ MILLION)
FIGURE 38: THAILAND IMMUNOSUPPRESSANT DRUGS MARKET, 2019-2028 (IN $ MILLION)
FIGURE 39: VIETNAM IMMUNOSUPPRESSANT DRUGS MARKET, 2019-2028 (IN $ MILLION)
FIGURE 40: AUSTRALIA & NEW ZEALAND IMMUNOSUPPRESSANT DRUGS MARKET, 2019-2028 (IN $ MILLION)
FIGURE 41: REST OF ASIA PACIFIC IMMUNOSUPPRESSANT DRUGS MARKET, 2019-2028 (IN $ MILLION
FIGURE 42: REST OF WORLD IMMUNOSUPPRESSANT DRUGS MARKET, REGIONAL OUTLOOK, 2019 & 2028 (IN %)
FIGURE 43: LATIN AMERICA IMMUNOSUPPRESSANT DRUGS MARKET, 2019-2028 (IN $ MILLION)
FIGURE 44: MIDDLE EAST & AFRICA IMMUNOSUPPRESSANT DRUGS MARKET, 2019-2028 (IN $ MILLION)
- MARKET BY DISTRIBUTION CHANNEL
- HOSPITAL PHARMACIES
- RETAIL PHARMACIES
- ONLINE PHARMACIES
- MARKET BY END-USER
- ORGAN TRANSPLANTATION
- AUTOIMMUNE DISORDERS
- OTHERS
- MARKET BY DRUG CLASS
- CORTICOSTEROIDS
- MONOCLONAL ANTIBODIES
- CALCINEURIN INHIBITORS
- MTOR INHIBITORS
- OTHERS
- GEOGRAPHICAL ANALYSIS
- NORTH AMERICA
- UNITED STATES
- CANADA
- EUROPE
- UNITED KINGDOM
- GERMANY
- FRANCE
- ITALY
- RUSSIA
- BELGIUM
- POLAND
- REST OF EUROPE
- ASIA PACIFIC
- CHINA
- JAPAN
- INDIA
- SOUTH KOREA
- INDONESIA
- THAILAND
- VIETNAM
- AUSTRALIA & NEW ZEALAND
- REST OF ASIA PACIFIC
- REST OF WORLD
- LATIN AMERICA
- MIDDLE EAST & AFRICA
- NORTH AMERICA
To request a free sample copy of this report, please complete the form below :
We offer 10% free customization including country-level data, niche applications and competitive landscape with every report.
Choose License Type
RELATED REPORTS
-

GLOBAL HALAL PHARMACEUTICALS MARKET FORECAST 2025-2032
-

ASIA-PACIFIC HALAL PHARMACEUTICALS MARKET FORECAST 2025-2032
-

EUROPE HALAL PHARMACEUTICALS MARKET FORECAST 2025-2032
-

NORTH AMERICA HALAL PHARMACEUTICALS MARKET FORECAST 2025-2032
-

LATIN AMERICA HALAL PHARMACEUTICALS MARKET FORECAST 2025-2032
-

MIDDLE EAST & AFRICA HALAL PHARMACEUTICALS MARKET FORECAST 2025-2032
-

EGYPT HALAL PHARMACEUTICALS MARKET FORECAST 2025-2032
-

MALAYSIA HALAL PHARMACEUTICALS MARKET FORECAST 2025-2032
-

INDONESIA HALAL PHARMACEUTICALS MARKET FORECAST 2025-2032
-

GLOBAL HALAL NUTRACEUTICALS MARKET FORECAST 2025-2032