EUROPE FISH OIL MARKET FORECAST 2021-2028
Europe Fish Oil Market by Species (Anchovy, Mackerel, Sardines, Cod, Herring, Menhaden, Other Species) by Application (Aquaculture (Salmon & Trout, Marine Fish, Crustaceans, Tilapias, Eels, Cyprinids, Other Aquaculture), Animal Nutrition & Pet Food, Pharmaceuticals, Supplements & Functional Food, Other Applications) and by Geography
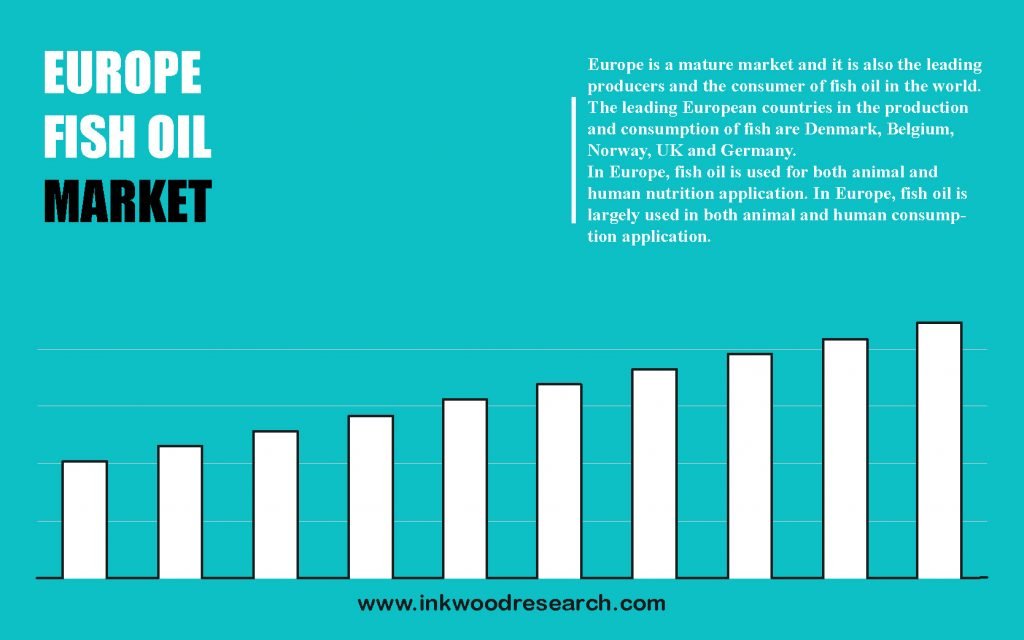
The Europe fish oil market is projected to grow with a CAGR of 5.97% in terms of revenue, and 4.39% in terms of volume, during the forecast years of 2021 to 2028. The region’s market growth is driven by the increased animal and human nutrition applications, the rising health awareness among consumers, and the augmenting aquaculture industry.

To learn more about this report, request a free sample copy
The Europe fish oil market growth is evaluated by assessing Germany, Denmark, the United Kingdom, Norway, Belgium, and the rest of Europe. The United Kingdom’s aquaculture industry manufactures a wide variety of shellfish and finfish species, for restocking fisheries, ornamental trade, and consumption. Besides, trout and salmon fish dominate the country’s industry, accounting for more than 52% of the production in terms of value and volume. The increase in technological developments across the United Kingdom has ensured the sustainability of aquaculture, with minimal environmental impacts. Additionally, developments like aquaponic systems, on-land recirculating aquaculture systems, offshore systems, and the use of information technology, has further bolstered the country’s aquaculture industry.
Denmark possesses one of the longest coastlines, globally. As a result, this aspect substantially augments the nation’s fishing trade. Denmark is also a key consumer as well as producer of fish oil, primarily obtained from sprat, Norway pout, sand eel, and herring. In this regard, the country produces over 60 kilotons of fish oil, annually. Moreover, the industry is completely regulated by the European Union’s Fisheries Management. Hence, these factors are set to drive the Europe fish oil market growth during the forecast period.
Marvesha Holdings NC, headquartered in the Netherlands, is a client-driven distribution and trading organization, operating across markets such as nutrition, pharma, feed, and fish, and vegetable oil solutions. The company is dedicated to its producers’ and supply network. Moreover, it customizes products to fulfill the market and individual customer requirements, as well.
To request a free sample copy of this report, please complete the form below :
We offer 10% free customization including country-level data, niche applications and competitive landscape with every report.
- RESEARCH SCOPE & METHODOLOGY
- STUDY OBJECTIVES
- SCOPE OF STUDY
- METHODOLOGY
- ASSUMPTIONS & LIMITATIONS
- EXECUTIVE SUMMARY
- MARKET SIZE & ESTIMATES
- MARKET OVERVIEW
- MARKET DYNAMICS
- KEY DRIVERS
- SIGNIFICANT GROWTH IN THE AQUACULTURE INDUSTRY
- HEALTH BENEFITS OF FISH OIL
- INCREASING DEMAND FOR FISH OIL AMONG THE ELDERLY
- RISING DEMAND FROM SUPPLEMENT AND FUNCTIONAL FOOD APPLICATIONS
- KEY RESTRAINTS
- UNFAVORABLE CLIMATIC CONDITIONS
- LACK OF FISH OIL SUPPLY
- STERN GOVERNMENT REGULATIONS
- KEY DRIVERS
- KEY ANALYTICS
- IMPACT OF COVID-19 ON FISH OIL MARKET
- KEY INVESTMENT INSIGHTS
- PORTER’S FIVE FORCE ANALYSIS
- BUYER POWER
- SUPPLIER POWER
- SUBSTITUTION
- NEW ENTRANTS
- INDUSTRY RIVALRY
- OPPORTUNITY MATRIX
- VENDOR LANDSCAPE
- MARKET BY SPECIES
- ANCHOVY
- MACKEREL
- SARDINES
- COD
- HERRING
- MENHADEN
- OTHER SPECIES
- MARKET BY APPLICATION
- AQUACULTURE
- SALMON & TROUT
- MARINE FISH
- CRUSTACEANS
- TILAPIAS
- EELS
- CYPRINIDS
- OTHER AQUACULTURE
- ANIMAL NUTRITION & PET FOOD
- PHARMACEUTICALS
- SUPPLEMENTS & FUNCTIONAL FOOD
- OTHER APPLICATIONS
- AQUACULTURE
- GEOGRAPHICAL ANALYSIS
- EUROPE
- KEY GROWTH ENABLERS
- KEY CHALLENGES
- KEY PLAYERS
- COUNTRY ANALYSIS
- UNITED KINGDOM
- GERMANY
- DENMARK
- NORWAY
- BELGIUM
- REST OF EUROPE
- EUROPE
- COMPETITIVE LANDSCAPE
- KEY STRATEGIC DEVELOPMENTS
- MERGER & ACQUISITIONS
- PARTNERSHIP, CONTRACT/AGREEMENT & COLLABORATION
- BUSINESS EXPANSION
- COMPANY PROFILES
- OMEGA PROTEIN CORPORATION
- FMC CORPORATION
- COPEINCA AS
- CORPESCA SA
- COLPEX INTERNATIONAL
- TRIPLENINE GROUP A/S
- FF SKAGEN A/S
- MARVESA HOLDINGS NV
- PESQUERA DIAMANTE SA
- PESQUERA EXALMAR
- ROYAL DSM NV
- CRODA INTERNATIONAL PLC
- BASF SE
- GC REIBER VIVOMEGA OILS
- LYSI HF
- KEY STRATEGIC DEVELOPMENTS
TABLE LIST
TABLE 1: MARKET SNAPSHOT – FISH OIL
TABLE 2: EUROPE FISH OIL MARKET, BY SPECIES, HISTORICAL YEARS, 2016-2020 (IN $ MILLION)
TABLE 3: EUROPE FISH OIL MARKET, BY SPECIES, FORECAST YEARS, 2021-2028 (IN $ MILLION)
TABLE 4: EUROPE FISH OIL MARKET, BY SPECIES, HISTORICAL YEARS, 2016-2020 (IN KILOTONS)
TABLE 5: EUROPE FISH OIL MARKET, BY SPECIES, FORECAST YEARS, 2021-2028 (IN KILOTONS)
TABLE 6: EUROPE FISH OIL MARKET, BY APPLICATION, HISTORICAL YEARS, 2016-2020 (IN $ MILLION)
TABLE 7: EUROPE FISH OIL MARKET, BY APPLICATION, FORECAST YEARS, 2021-2028 (IN $ MILLION)
TABLE 8: EUROPE FISH OIL MARKET, BY APPLICATION, HISTORICAL YEARS, 2016-2020 (IN KILOTONS)
TABLE 9: EUROPE FISH OIL MARKET, BY APPLICATION, FORECAST YEARS, 2021-2028 (IN KILOTONS)
TABLE 10: EUROPE FISH OIL MARKET, BY AQUACULTURE, HISTORICAL YEARS, 2016-2020 (IN $ MILLION)
TABLE 11: EUROPE FISH OIL MARKET, BY AQUACULTURE, FORECAST YEARS, 2021-2028 (IN $ MILLION)
TABLE 12: EUROPE FISH OIL MARKET, BY AQUACULTURE, HISTORICAL YEARS, 2016-2020 (IN KILOTONS)
TABLE 13: EUROPE FISH OIL MARKET, BY AQUACULTURE, FORECAST YEARS, 2021-2028 (IN KILOTONS)
TABLE 14: EUROPE FISH OIL MARKET, BY COUNTRY, HISTORICAL YEARS, 2016-2020 (IN $ MILLION)
TABLE 15: EUROPE FISH OIL MARKET, BY COUNTRY, FORECAST YEARS, 2021-2028 (IN $ MILLION)
TABLE 16: EUROPE FISH OIL MARKET, BY COUNTRY, HISTORICAL YEARS, 2016-2020 (IN KILOTONS)
TABLE 17: EUROPE FISH OIL MARKET, BY COUNTRY, FORECAST YEARS, 2021-2028 (IN KILOTONS)
TABLE 18: LEADING PLAYERS OPERATING IN EUROPE FISH OIL MARKET
FIGURE LIST
FIGURE 1: KEY INVESTMENT INSIGHTS
FIGURE 2: PORTER’S FIVE FORCE ANALYSIS
FIGURE 3: OPPORTUNITY MATRIX
FIGURE 4: VENDOR LANDSCAPE
FIGURE 5: EUROPE FISH OIL MARKET, GROWTH POTENTIAL, BY SPECIES, IN 2020
FIGURE 6: EUROPE FISH OIL MARKET, BY ANCHOVY, 2021-2028 (IN $ MILLION)
FIGURE 7: EUROPE FISH OIL MARKET, BY MACKEREL, 2021-2028 (IN $ MILLION)
FIGURE 8: EUROPE FISH OIL MARKET, BY SARDINES, 2021-2028 (IN $ MILLION)
FIGURE 9: EUROPE FISH OIL MARKET, BY COD, 2021-2028 (IN $ MILLION)
FIGURE 10: EUROPE FISH OIL MARKET, BY HERRING, 2021-2028 (IN $ MILLION)
FIGURE 11: EUROPE FISH OIL MARKET, BY MENHADEN, 2021-2028 (IN $ MILLION)
FIGURE 12: EUROPE FISH OIL MARKET, BY OTHER SPECIES, 2021-2028 (IN $ MILLION)
FIGURE 13: EUROPE FISH OIL MARKET, GROWTH POTENTIAL, BY APPLICATION, IN 2020
FIGURE 14: EUROPE FISH OIL MARKET, BY AQUACULTURE, 2021-2028 (IN $ MILLION)
FIGURE 15: EUROPE FISH OIL MARKET, GROWTH POTENTIAL, BY AQUACULTURE, IN 2020
FIGURE 16: EUROPE FISH OIL MARKET, BY SALMON & TROUT, 2021-2028 (IN $ MILLION)
FIGURE 17: EUROPE FISH OIL MARKET, BY MARINE FISH, 2021-2028 (IN $ MILLION)
FIGURE 18: EUROPE FISH OIL MARKET, BY CRUSTACEANS, 2021-2028 (IN $ MILLION)
FIGURE 19: EUROPE FISH OIL MARKET, BY TILAPIAS, 2021-2028 (IN $ MILLION)
FIGURE 20: EUROPE FISH OIL MARKET, BY EELS, 2021-2028 (IN $ MILLION)
FIGURE 21: EUROPE FISH OIL MARKET, BY CYPRINIDS, 2021-2028 (IN $ MILLION)
FIGURE 22: EUROPE FISH OIL MARKET, BY OTHER AQUACULTURE, 2021-2028 (IN $ MILLION)
FIGURE 23: EUROPE FISH OIL MARKET, BY ANIMAL NUTRITION & PET FOOD, 2021-2028 (IN $ MILLION)
FIGURE 24: EUROPE FISH OIL MARKET, BY PHARMACEUTICALS, 2021-2028 (IN $ MILLION)
FIGURE 25: EUROPE FISH OIL MARKET, BY SUPPLEMENTS & FUNCTIONAL FOOD, 2021-2028 (IN $ MILLION)
FIGURE 26: EUROPE FISH OIL MARKET, BY OTHER APPLICATIONS, 2021-2028 (IN $ MILLION)
FIGURE 27: EUROPE FISH OIL MARKET, REGIONAL OUTLOOK, 2020 & 2028 (IN %)
FIGURE 28: UNITED KINGDOM FISH OIL MARKET, 2021-2028 (IN $ MILLION)
FIGURE 29: GERMANY FISH OIL MARKET, 2021-2028 (IN $ MILLION)
FIGURE 30: DENMARK FISH OIL MARKET, 2021-2028 (IN $ MILLION)
FIGURE 31: NORWAY FISH OIL MARKET, 2021-2028 (IN $ MILLION)
FIGURE 32: BELGIUM FISH OIL MARKET, 2021-2028 (IN $ MILLION)
FIGURE 33: REST OF EUROPE FISH OIL MARKET, 2021-2028 (IN $ MILLION)
- GEOGRAPHICAL ANALYSIS
- EUROPE
- KEY GROWTH ENABLERS
- KEY CHALLENGES
- KEY PLAYERS
- COUNTRY ANALYSIS
- UNITED KINGDOM
- GERMANY
- DENMARK
- NORWAY
- BELGIUM
- REST OF EUROPE
- EUROPE
- MARKET BY SPECIES
- ANCHOVY
- MACKEREL
- SARDINES
- COD
- HERRING
- MENHADEN
- OTHER SPECIES
- MARKET BY APPLICATION
- AQUACULTURE
- SALMON & TROUT
- MARINE FISH
- CRUSTACEANS
- TILAPIAS
- EELS
- CYPRINIDS
- OTHER AQUACULTURE
- ANIMAL NUTRITION & PET FOOD
- PHARMACEUTICALS
- SUPPLEMENTS & FUNCTIONAL FOOD
- OTHER APPLICATIONS
- AQUACULTURE
To request a free sample copy of this report, please complete the form below :
We offer 10% free customization including country-level data, niche applications and competitive landscape with every report.


