

ALGERIA LIQUEFIED NATURAL GAS (LNG) MARKET
Natural gas is a fossil fuel majorly comprising methane. Like other fossil fuels, it is formed deep beneath the earth’s surface due to the decomposition of dead plants and animals under extreme heat and pressures. Although natural gas is cleaner than the majority of other fossilized fuels, its calorific value is lower than fossil fuels such as petrol, diesel, and LPG. Liquified natural gas (LNG) entails compressed natural gas liquified at -290 degrees, useful for transportation and heat generation.
To learn more about this report, request a free sample copy
Lower price, higher production, and lower carbon footprints are some of the key factors driving the liquefied natural gas market in Algeria. Moreover, the total proved reserves of the country as of 2020 is 12.6 million cubic meters. Algeria is also an emerging LNG exporter in Africa.
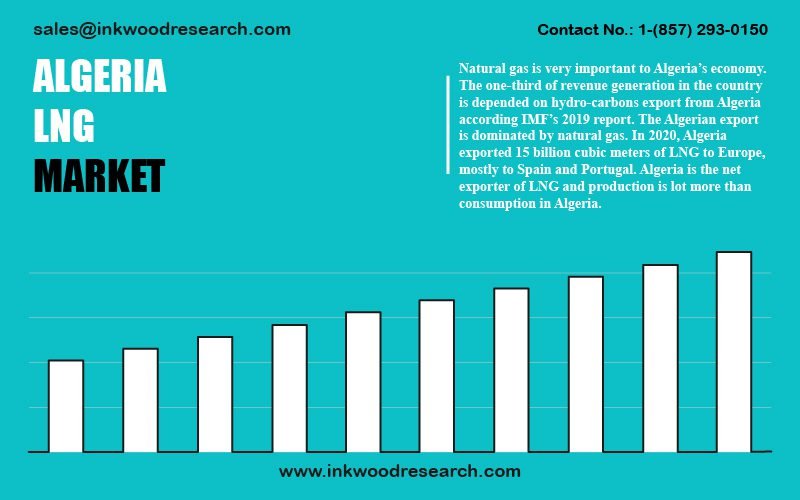
Natural gas is highly crucial to Algeria’s economy. One-third of the country’s revenue generation is dependent on hydro-carbons export from Algeria, according to IMF’s 2019 report. However, due to the increase in vulnerability, as the reliance on hydro-carbons rises, poly-makers have decided to reduce the domestic consumption of oil and gas by 3% until the year 2030.
While natural gas was discovered in 1956 in the country, Algeria has been a member of the OPEC since 1969. Hassi R’Mel was the first as well as the largest natural gas field in the country since its inception in 1956. Furthermore, the field holds proved reserves of 85 trillion cubic feet.
Over the last decade, exports have decreased in the country with an increase in consumption. Presently, Algeria has six LNG terminals with an export capacity of 32.56 billion cubic meters per year. In addition, Italy and Spain are the largest purchasers of Algerian natural gas, accounting for 667 bcf and 527 bcf, respectively.
Algeria ranked 17th and 44th in terms of total energy production and electricity consumption in the year 2018. Besides, Algeria exports more natural gas compared to oil, and the increasing consumption of gas was a record high in the country from 2008 to 2018. The main areas of domestic natural gas consumption in Algeria include electricity, gas stations, households, commercial sectors, fuel in vehicles, and large industries, with electricity consumption capturing 42% of natural gas use.
The top LNG companies in the country are Sonatrach and Shell Ltd.
To request a free sample copy of this report, please complete the form below:
We offer 10% free customization including country-level data, niche applications and competitive landscape with every report.
- ALGERIA LNG MARKET: EXECUTIVE SUMMARY
- ALGERIA OVERALL ECONOMIC CONDITIONS
- ALGERIA PRIMARY ENERGY CONSUMPTION
- NATURAL GAS
- ALGERIA NATURAL GAS TOTAL PROVED RESERVES, PRODUCTION, AND CONSUMPTION
- TOTAL PROVED RESERVES
- NATURAL GAS PRODUCTION
- NATURAL GAS CONSUMPTION
- ALGERIA NATURAL GAS TOTAL PROVED RESERVES, PRODUCTION, AND CONSUMPTION
- LIQUIFIED NATURAL GAS
- VALUE CHAIN ANALYSIS
- EXPLORATION AND PRODUCTION
- LIQUEFACTION
- SHIPPING
- STORAGE AND REGASIFICATION
- END-USERS
- TRADE
- EXPORTS
- LNG TERMINALS
- LIST OF LNG EXPORT TERMINALS
- REGULATORY FRAMEWORK FOR LNG
- VALUE CHAIN ANALYSIS
LIST OF TABLES
TABLE 1: ALGERIA NATURAL GAS PRODUCTION, 2016-2020 (IN EXAJOULES)
TABLE 2: ALGERIA NATURAL GAS CONSUMPTION, 2016-2020 (IN EXAJOULES)
TABLE 3: ALGERIA LNG EXPORTS, 2016-2020 (IN BILLION CUBIC METERS)
TABLE 4: LNG EXPORT TERMINALS, EXISTING
TABLE 5: REGULATORY FRAMEWORK
LIST OF FIGURES
FIGURE 1: ALGERIA GROSS DOMESTIC PRODUCT, 2016-2020 ($ BILLION)
FIGURE 2: PRIMARY ENERGY CONSUMPTION, BY FUEL TYPES, 2019 & 2020 (IN %)
FIGURE 3: PRIMARY ENERGY CONSUMPTION, 2016-2020 (EXAJOULES)
FIGURE 4: ALGERIA NATURAL GAS TOTAL PROVED RESERVES, 2000, 2010, AND 2020 (IN TRILLION CUBIC METERS)
FIGURE 5: ALGERIA NATURAL GAS PRODUCTION VS CONSUMPTION, 2016-2020 (IN EXAJOULES)
FIGURE 6: VALUE CHAIN ANALYSIS
ALGERIA GROSS DOMESTIC PRODUCT, 2016-2020, ($ BILLION)
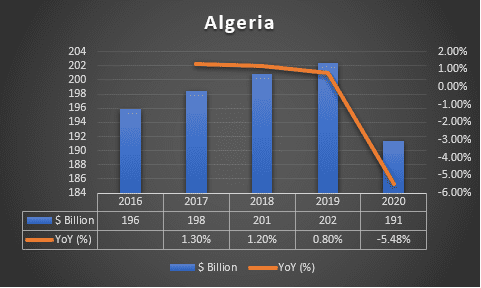
GDP (constant 2010 US$)
Source: World Bank
To request a free sample copy of this report, please complete the form below :
We offer 10% free customization including country-level data, niche applications and competitive landscape with every report.
Choose License Type
RELATED REPORTS
-

UNITED STATES DATA CENTER ENERGY STORAGE MARKET FORECAST 2025-2032
-

INDIA DATA CENTER ENERGY STORAGE MARKET FORECAST 2025-2032
-

GERMANY DATA CENTER ENERGY STORAGE MARKET FORECAST 2025-2032
-

BRAZIL DATA CENTER ENERGY STORAGE MARKET FORECAST 2025-2032
-
GLOBAL DATA CENTER ENERGY STORAGE MARKET FORECAST 2025-2032
-

POLAND MOBILE IMAGING SERVICES MARKET FORECAST 2025-2032
-

UNITED STATES MOBILE IMAGING SERVICES MARKET FORECAST 2025-2032
-

INDIA MOBILE IMAGING SERVICES MARKET FORECAST 2025-2032
-

VIETNAM BABY DIAPER MARKET FORECAST 2025-2032
-

UNITED STATES BABY DIAPER MARKET FORECAST 2025-2032